
Scraping one web page is fun, but scraping more web pages is more fun. In this tutorial you’ll learn how to do just that; along the way you’ll also make good use of your collected data by doing some visualizations and analyses. While in the previous article you learned to crawl, now it’s time for you to stand up and learn to walk. 🙂
How to inspect URLs for web scraping
IMPORTANT UPDATE 2023-05-02: Book Depository has unfortunately closed. We are sorry to see that for two reasons. 1) It was a great online store. 2) This article was based on their e-commerce store’s online data. Until we update the article, please note that the methods described in this article still work, but they won’t work with Book Depository specifically from now on, for obvious reasons.
If you recall, in the previous part of this tutorial series we scraped only the first bestsellers page of Book Depository. Truth is, there are actually 34 pages of bestseller books that we can scrape:
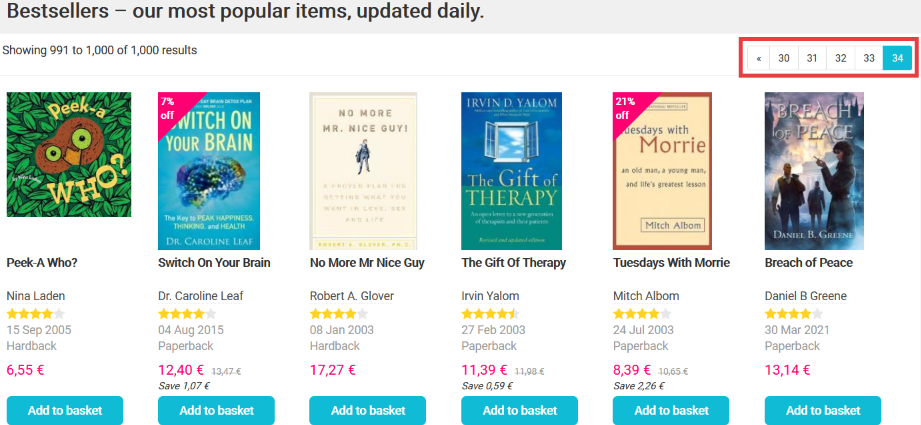
Question: how do we scrape all 34 pages?
Answer: by first inspecting what’s happening in the URL when we switch pages.
This is the first page’s URL: https://www.bookdepository.com/bestsellers
By going to the second page, you’ll notice that the URL changes to this: https://www.bookdepository.com/bestsellers?page=2
The only difference is that ?page=2 has been appended to the base URL. Now let’s check out what happens if we visit the third page: https://www.bookdepository.com/bestsellers?page=3
?page=2 turned into ?page=3; can you see where I’m going with this? 🙂
It seems that by changing the number after page=, we can go to whichever page we want to. Let’s try this out real quick by replacing 3 with 28 (https://www.bookdepository.com/bestsellers?page=28):
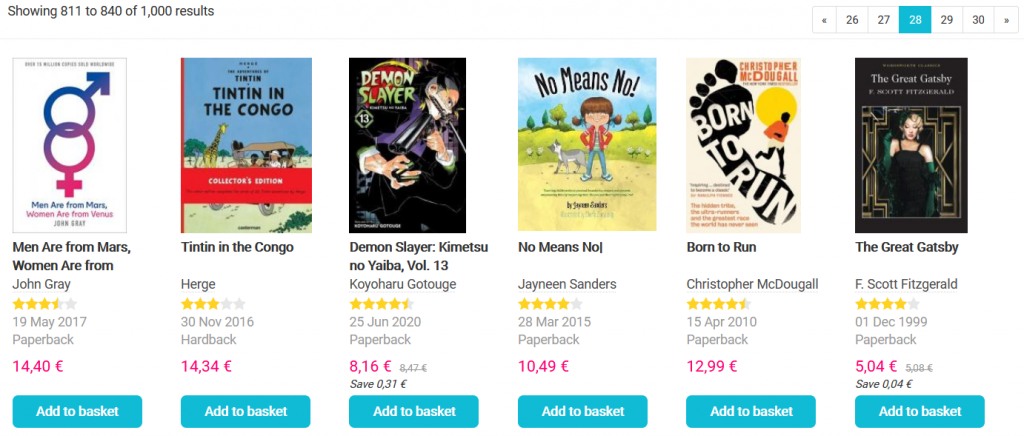
See? It works like a charm. 😉
But wait… what about the first page? It had no ?page=number in it! 🤔
Lucky for us, https://www.bookdepository.com/bestsellers?page=1 and https://www.bookdepository.com/bestsellers are the same page with the same book results, so it seems that we’ve found a reliable solution that we can use to navigate between web pages by changing the URL.
Shortly I’ll show you how you can bring this knowledge over to web scraping, but first a quick explanation to the curious minds out there as to what the heck this ?page=number thing is exactly.
The ? part of a URL signifies the start of the so-called query string. Anything that comes after the ? is the query string itself, which contains key-value pairs. In our case page is the key and the number we assign to it is its value. By assigning a certain number to page, we are able to request the bestsellers page corresponding to that number. Easy-peasy. 🙂
Now, let’s put this knowledge to good use.
Scraping multiple web pages with a while loop
To complete this tutorial, we’ll need to use the same libraries from the previous article, so don’t forget to import them:
from bs4 import BeautifulSoup as bs
import requests
import numpy as np
import pandas as pd
import matplotlib.pyplot as plt
%matplotlib inline
(Remember: %matplotlib inline is necessary for the later data visualizations to appear if you write your code in Jupyter Notebook.)
What we’ll do in this article will be very similar to what we’ve already accomplished so far, but with more data: we’ll analyze not 30, but 1020 books.
For this reason we’ll reuse (with some small modifications) the code we’ve already written to get the titles, formats, publication years and prices of the bestseller books. To scrape multiple pages, we’ll use a while loop and the page parameters in the URLs. Keep in mind that the bestsellers list is updated daily, so don’t freak out if you don’t get the same data that are shown in this tutorial.
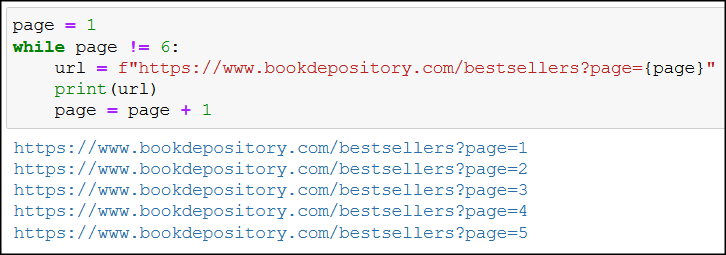
For starters, it’s always a good idea to build your code up step by step, so if you run into an error, you’ll immediately know which part of your code needs some rethinking. As a first step we may want to check if we can get the first 5 bestsellers URLs:
page = 1
while page != 6:
      url = f"https://www.bookdepository.com/bestsellers?page={page}"
      print(url)
      page = page + 1
As the output attests, we’ve succeeded in our endeavour:
Here’s the breakdown of the code:
- we create the variable
pagethat initially holds1as its value (because we want to start from the first bestsellers page), while page != 6:makes sure that our code stops running whenpagegets the value6(which would mean the sixth bestsellers page); because we’re only interested in the first 5 pages, we won’t be bothering with the sixth page,- the variable
urlwill hold the bestsellers page’s URL at every iteration in a string format; we use f-strings that lets{page}receive the current value ofpage,- at the first iteration we have
page=1, sourlwill be:https://www.bookdepository.com/bestsellers?page=1, - at the second iteration we have
page=2, sourlbecomes:https://www.bookdepository.com/bestsellers?page=2, - and the last URL will be:
https://www.bookdepository.com/bestsellers?page=5.
- at the first iteration we have
print(url)prints the current URL, so we can check if we get the results we intended to get,- then we increase the value of
pageby one at the end of every iteration.
Collecting all bestseller books’ titles
Let’s modify our while loop just a little bit so we can loop through all 34 bestsellers pages, and get every bestseller’s title:
page = 1
titles = []
while page != 35:
      url = f"https://www.bookdepository.com/bestsellers?page={page}"
      response = requests.get(url)
      html = response.content
      soup = bs(html, "lxml")
      for h3 in soup.find_all("h3", class_="title"):
            titles.append(h3.get_text(strip=True))
      page = page + 1
As you’ve noticed, this code is not so different from the first while loop:
- with
while page != 35we get all bestsellers pages, not just the first 5, response = requests.get(url),html = response.content, andsoup = bs(html, "lxml")are parts that you’re already familiar with (requesting pages, then creating asoupobject from which we can extract the HTML content we need),- we loop through all
h3elements with the class oftitle(for h3 in soup.find_all("h3", class_="title"):) to get the book titles, - we add each book title (
titles.append(h3.get_text(strip=True));strip=Trueremoves whitespaces) to thetitleslist that we created before the while loop.
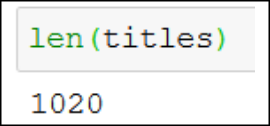
If we check the length of titles, we get 1020 as the output, which is correct, because 30 books on a page and 34 pages (30*34) gives us 1020 books:
Let’s also print out the first 5 items of titles, just to check if we really managed to save the books’ titles:
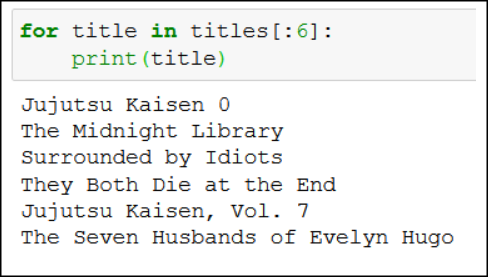
I believe we’ve got what we wanted, so let’s move on. 🙂
Getting the formats of the books
Remember how we got the books’ formats in the previous tutorial? Let me paste the code here:
formats = soup.select("div.item-info p.format")
formats_series = pd.Series(formats)
formats_series.value_counts()
We can reuse the same code in a while loop for all 34 pages (note that I’ve renamed formats to formats_on_page):
page = 1
formats_all = []
while page != 35:
      url = f"https://www.bookdepository.com/bestsellers?page={page}"
      response = requests.get(url)
      html = response.content
      soup = bs(html, "lxml")
      formats_on_page = soup.select("div.item-info p.format")
      for product_format in formats_on_page:
            formats_all.append(product_format.get_text())
      page = page + 1
formats_series = pd.Series(formats_all)
formats_series.value_counts()
Running the above code will result in this output:
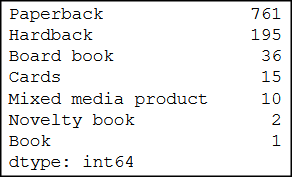
The logic is completely the same as in the case of book titles:
- we need a list (
formats_all) where we can store the books’ formats (paperback, hardback, etc.), - in a while loop we request and create a BeautifulSoup representation of every page,
- at every iteration we find every HTML element that holds a book’s format (
formats_on_page = soup.select("div.item-info p.format")), - then we loop through (
for product_format in formats_on_page:) every book format that we’ve found in the previous step, just to add their text content (for instance Paperback) toformats_all(formats_all.append(product_format.get_text())), - and finally with the help of good old pandas we convert
formats_allinto a pandas series (formats_series = pd.Series(formats_all)), so we can count the number of occurrences of every book format (formats_series.value_counts()).
As you can see in the above screenshot, most bestseller books are paperback (761), which – I think – is not that surprising, but good to know nonetheless. 🙂
You may wonder, though, exactly what percentage of bestsellers are our 761 paperbacks?
normalize=True to the rescue!
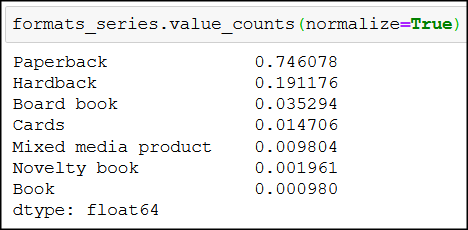
You see, by adding normalize=True to .value_counts(), instead of exact numbers, we get the relative frequencies of the unique values in formats_series. So the 761 paperback books constitute around 75% of all bestseller books – nice!
Following the same steps we can easily create a while loop for the publication years and prices as well.
But I won’t paste the code here, just so you can find the solution out for yourself (you know, practice makes perfect 😉).
(Hint: use a while loop and read the previous article’s “Getting the book formats” section to find the solution. Alternatively, later in this article the “Saving all scraped data into data-frames” section may also be of great help.)
However, I will show you what else we can do with some more data…
Visualizing bestseller books by publication year
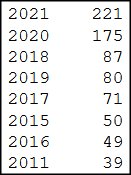
Once you’ve created years_series and applied .value_counts() on it (in the previous section I’ve showed you how you can do it through the example of formats_series), you’ll have a pandas series object where the index column contains the publication years, and the corresponding values show the number of bestseller books published in that year (the screenshot doesn’t contain the whole series):
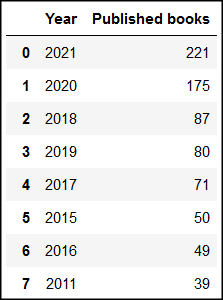
years_series.value_counts() can be easily converted into a pandas dataframe object:
years_df = years_series.value_counts().to_frame().reset_index()
years_df.rename(columns={"index":"Year", 0:"Published books"}, inplace=True)
Your dataframe will appear like this:
In the above code .to_frame() converts the series object into a dataframe, then .reset_index() creates a new index column (beginning from 0), so that the original index column (with the publication years) can be created as a normal column in the dataframe next to the books column:
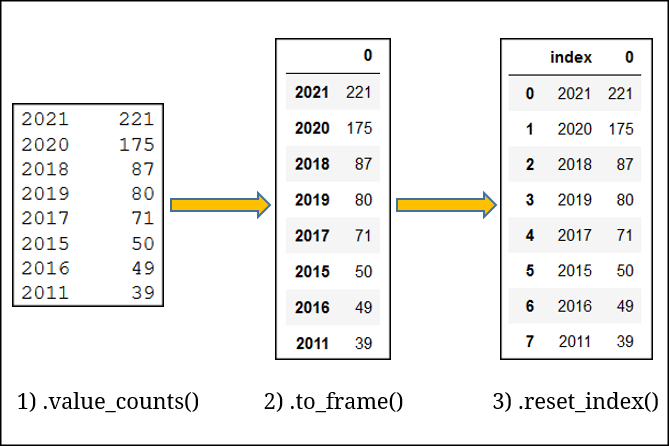
Then the .rename() method takes care of renaming “index” and “0” to “Year” and “Published books”, respectively.
Of course, a dataframe looks better than a series, but a bar chart looks even better than a dataframe:
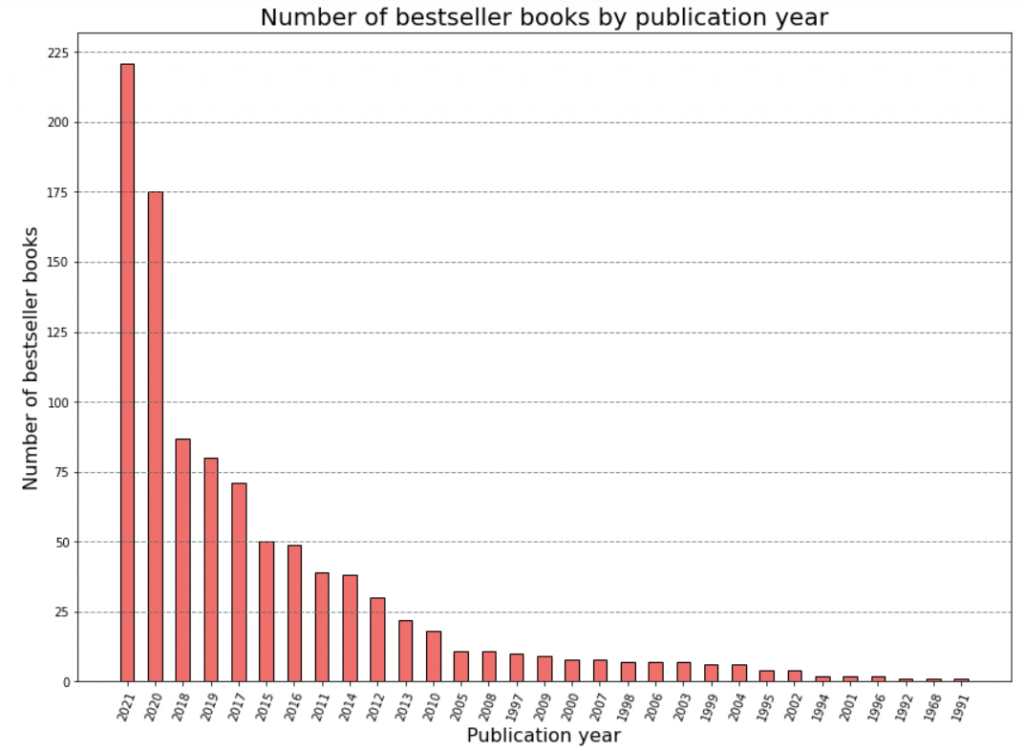
As you can see, most bestseller books have been published this year (surprise, surprise 🙂), but there’s also some gems from the 1990s.
Here’s the code with which you can reproduce a similar chart:
plt.figure(figsize=(14, 10))
plt.title("Number of bestseller books by publication year", fontsize = 20)
plt.yticks(np.arange(0, 275, step=25))
plt.xticks(rotation= 70)
plt.ylabel("Number of bestseller books", fontsize = 16)
plt.xlabel("Publication year", fontsize = 16)
plt.bar(years_df["Year"], years_df["Published books"], width = 0.5, color = "#EF6F6C", edgecolor = "black")
plt.grid(color='#59656F', linestyle='--', linewidth=1, axis='y', alpha=0.7)
I won’t give you a deeper explanation regarding which line does what, but I do recommend that you check out Keith Galli’s and codebasics’ video on bar charts (and of course, the original matplotlib documentation).
Saving all scraped data into dataframes
In the introduction to web scraping article we created a histogram out of books’ prices; we won’t do that again based on all prices, because I’m sure that by now you can figure it out by yourself.
What I have in store for you this time is something more advanced.
What if we collected the title, the format, the publication year and the price data with one big while loop? Because in all honesty, there’s absolutely no need to scrape these data separately if we can do it in one go.
Doing so we can not only answer more interesting questions (What books are bestsellers today from the 1990s?), but we can also make easier comparisons (for instance differences in pricing between paperback and hardback books).
First, let me show you the one big while loop that collects every piece of data we need, then I’ll explain it in detail how it works, and after that we’ll do some more analysis.
So here’s the code:
page = 1
bestseller_books = []
while page != 35:
      url = f"https://www.bookdepository.com/bestsellers?page={page}"
      response = requests.get(url)
      html = response.content
      soup = bs(html, "lxml")
      for book in soup.find_all("div", class_="book-item"):
            bestseller_book = {}
            bestseller_book["title"] = book.h3.get_text(strip=True)
            bestseller_book["format"] = book.find("p", class_="format").get_text()
            try:
                  bestseller_book["year"] = book.find("p", class_="published").get_text()[-4:]
            except AttributeError:
                  bestseller_book["year"] = ""
            price = book.find("p", class_="price")
            try:
                  original_price = price.find("span", class_="rrp")
            except AttributeError:
                  bestseller_book["price"] = ""
            else:
                  if original_price:
                         current_price = str(original_price.previousSibling).strip()
                        current_price = float(current_price.split("€")[0].replace(",", "."))
                  else:
                        current_price = float(price.get_text(strip=True).split("€")[0].replace(",", "."))
                 bestseller_book["price"] = current_price
            bestseller_books.append(bestseller_book)
      page = page + 1
Let me explain how the code works:
- the whole code is just one big while loop that loops through all bestseller pages,
for book in soup.find_all("div", class_="book-item")finds every book on a given page,- then each books’ title, format, publication year and price is saved into a
bestseller_bookdictionary one by one; once abestseller_bookis fully created, it’s added to thebestseller_bookslist, bestseller_book["title"] = book.h3.get_text(strip=True)collects the books’ titles and saves them intobestseller_book,bestseller_book["format"] = book.find("p", class_="format").get_text()gets us the books’ formats and saves them intobestseller_book,bestseller_book["year"] = book.find("p", class_="published").get_text()[-4:]finds the publication years and saves them intobestseller_book; if there’s no publication information for a book, we receive anAttributeError: 'NoneType' object has no attribute 'get_text'error, so instead of letting this error stop our code from running, we assign the“”value tobestseller_book[“year”](this is handled by thetry-exceptblock),- with
price = book.find("p", class_="price")we search for the books’ prices: after this line of code we carry out the same steps we did in the previous article, then add each books’ selling price tobestseller_book["price"]; if no price exists for a book we add“”(this is done by thetry–except–elseblock), - finally we have our
bestseller_book, and add it to ourbestseller_bookslist (bestseller_books.append(bestseller_book)).
Let’s print out the first three books of bestseller_books to quickly check what we’ve just accomplished:
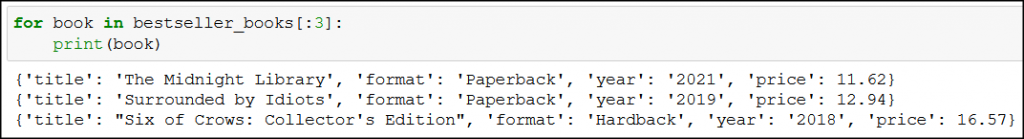
See? 🙂 We have all the information we need for every book in one place!
Why is it useful?
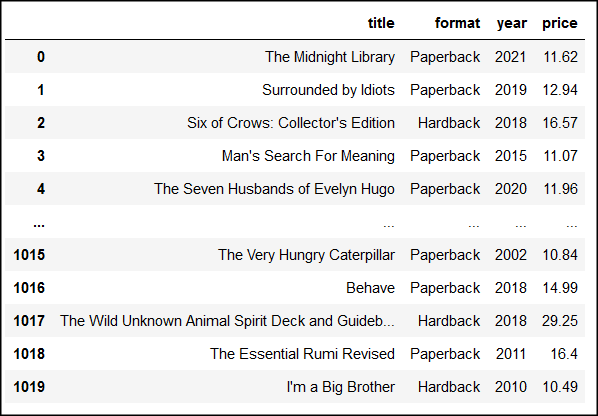
Because we can create a pandas dataframe out of it:

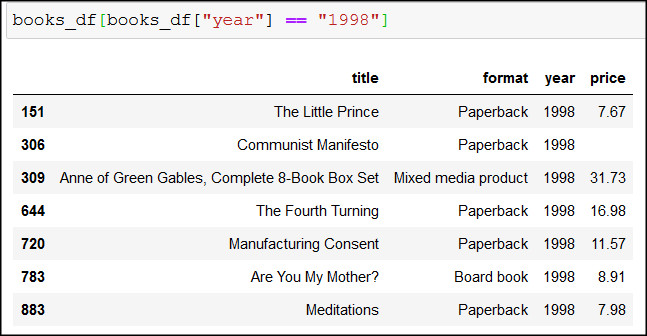
And then we can easily answer questions like what books are bestsellers from – let’s say – 1998:
Or which books cost more than 50 €:
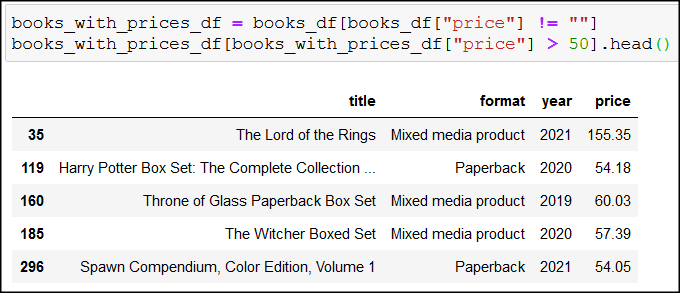
books_with_prices_df = books_df[books_df["price"] != ""] keeps only books that have available price information, then books_with_prices_df[books_with_prices_df["price"] > 50].head() shows the first five books above 50 €.
If you need a refresher on how pandas works, please read this tutorial series on the topic.
Comparing paperback and hardback books with boxplots
I’ve got one last cool visualization for you, and again, we’ll use the data from books_with_prices_df:
First, we’ll create two new dataframes out of books_with_prices_df: one that contains only paperback books (paperback_df), and another one for hardback books (hardback_df):
paperback_df = books_with_prices_df[books_with_prices_df["format"] == "Paperback"]
hardback_df = books_with_prices_df[books_with_prices_df["format"] == "Hardback"]
paperback_df = paperback_df.astype({"price": float})
hardback_df = hardback_df.astype({"price":float})
(We convert the string values of the price column into float type with .astype({“price”:float}.)
Let’s do a .describe() on both dataframes to summarize our data:
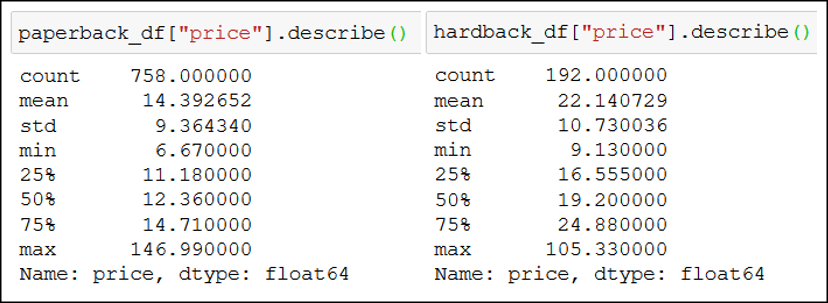
You can see that we have 758 (count) paperback books and 192 (count) hardback books. You may also notice that:
- you can expect to buy a bestseller paperback book for an average price (
mean) of 14.4 €, but for a hardback book you’d have to pay 22.14 €, - the cheapest paperback book is 6.7 €, while its hardback counterpart sells for 9.13 €,
- and interestingly, the most expensive (
max) paperback book (147 €) costs more than the most expensive hardback book (105.3 €).
We can also visualize these data with boxplots (note: I’ve added the texts (like Q3 (75%) manually next to the boxplots to make the boxplots more understandable):
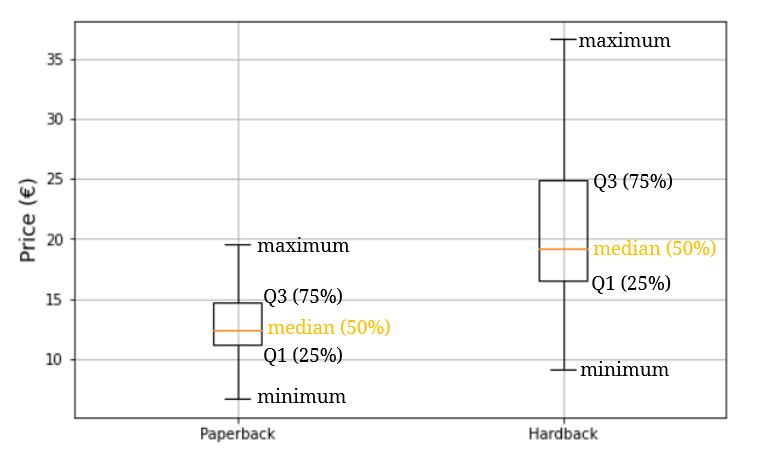
Boxplots are five-number summaries of datasets that show the minimum, the maximum, the median, the first quartile and the third quartile of a dataset. At a quick glance we can establish for example that paperback books have a lower median than hardback books, that the cheapest paperback book is cheaper than the cheapest hardback book, etc. Basically we can find information that we’ve got with the .describe() method above.
If you want to learn more about boxplots, watch this video and read this article.
Anyway, you can create the above boxplots with a few lines of code:
plt.figure(figsize=(8, 5))
plt.yticks(np.arange(0, 40, step=5))
plt.grid()
plt.boxplot([paperback_df["price"], hardback_df["price"]], labels=["Paperback", "Hardback"], showfliers=False)
(showfliers=False removes the outliers from the data, that’s the reason why the data are different on the boxplots from what .describe() shows us.)
If you’d like to read more about easy ways to summarize datasets, read this article on statistical averages, and this one on statistical variability.
Conclusion
Huh… we’ve covered a lot of ground. But it was worth it! 🙂 After finishing this article (and coding along, of course) now you have enough knowledge to scrape multiple pages, and collect some basic data.
Feel free to drop an email if you have a question or just would like to chat about web scraping. And don’t forget to subscribe to Tomi Mester’s newsletter, so you’ll be notified when the next article comes out in this web scraping series (we’ll be doing more advanced stuff, pinky promise).
Until then, keep practicing. 😉
- If you want to learn more about how to become a data scientist, take Tomi Mester’s 50-minute video course: How to Become a Data Scientist. (It’s free!)
- Also check out the 6-week online course: The Junior Data Scientist’s First Month video course.
Cheers,
Tamas Ujhelyi