Did you know that Python wasn’t originally built for Data Science? And yet today it’s one of the best languages for statistics, machine learning, and predictive analytics as well as simple data analytics tasks. How come? It’s an open-source language, and data professionals started creating tools for it to complete data tasks more efficiently. Here, I’ll introduce the most important Python libraries and packages that you have to know as a Data Scientist.
In my previous article, I introduced the Python import statement and the most important modules from the Python Standard Library. In this one, I’ll focus on the libraries and packages that are not coming with Python 3 by default. In the first half of the article, I’ll list and showcase them. And then, at the end of the article, I’ll also show you how to get (download, install and import) them.
Before we start
If you haven’t done so yet, I recommend going through these articles first:
- How to install Python, R, SQL and bash to practice data science
- Python for Data Science – Basics #1 – Variables and basic operations
- Python for Data Science – Basics #2 – Python Data Structures
- Python for Data Science – Basics #3 – Python Built-in Functions
- Python Import Statement and the Most Important Built-in Modules
Top 5 most important Python libraries and packages for Data Science
These are the five most essential Data Science libraries you have to know.
Let’s see them one by one!
How to Become a Data Scientist
(free 50-minute video course by Tomi Mester)
Just subscribe to the Data36 Newsletter here (it’s free)!
Thank you!
You have successfully joined our subscriber list.
Numpy
Numpy will help you to manage multi-dimensional arrays very efficiently. Maybe you won’t do that directly, but since the concept is a crucial part of data science, many other libraries (well, almost all of them) are built on Numpy. Simply put: without Numpy you won’t be able to use Pandas, Matplotlib, Scipy or Scikit-Learn. That’s why you need it on the first hand.
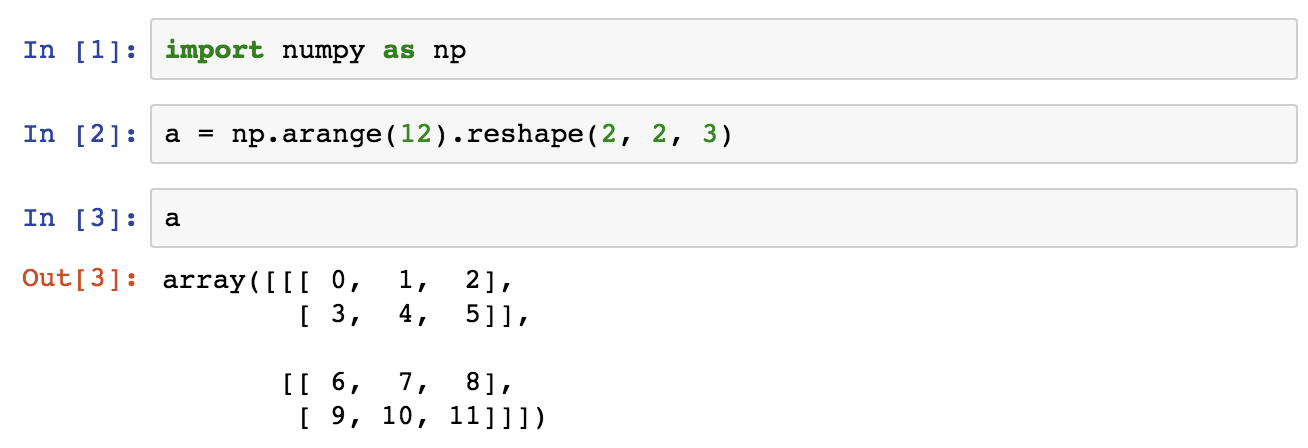
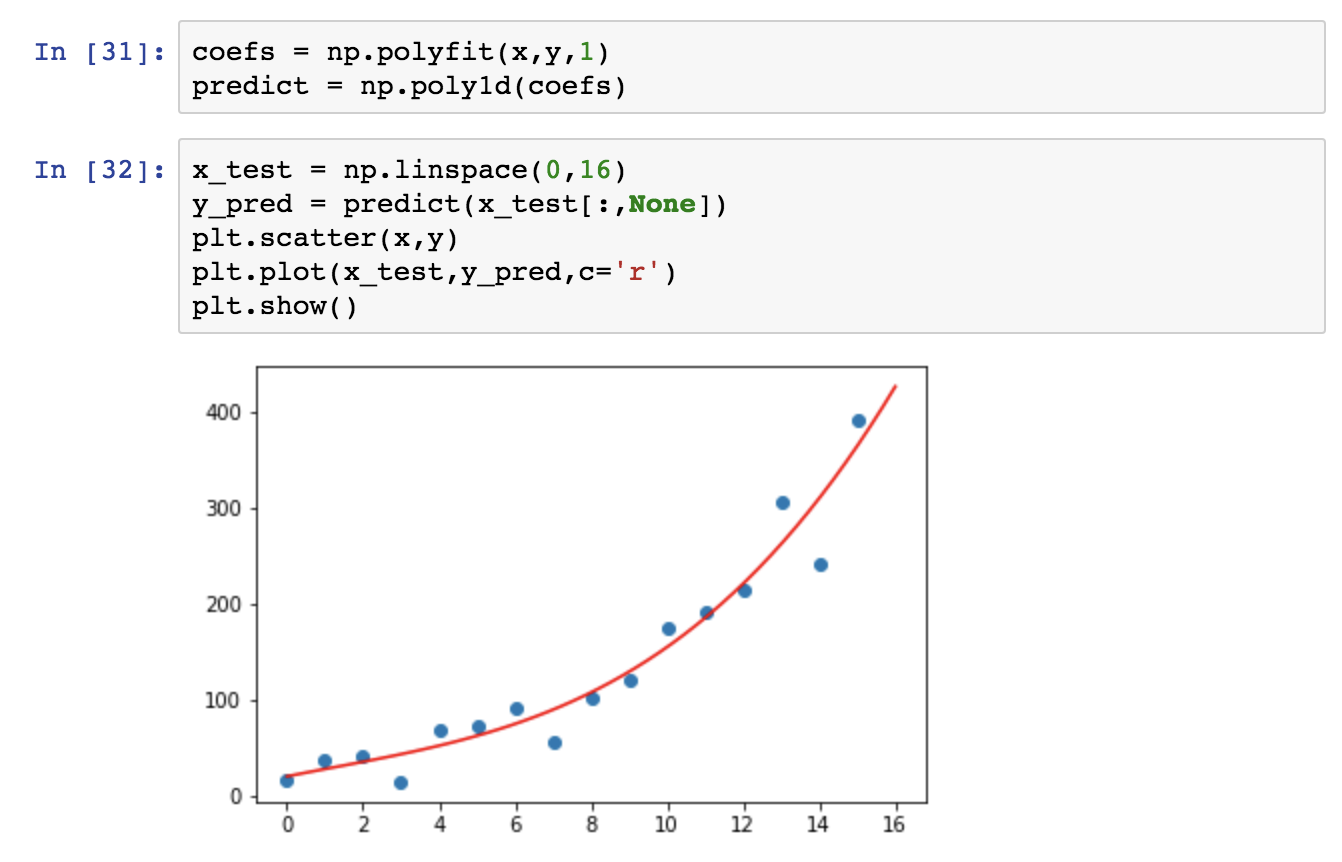
But on the other hand, it also has a few well-implemented methods. I quite often use Numpy’s random function, which I found slightly better than the random module of the standard library. And when it comes to simple predictive analytics tasks like linear or polynomial regression, Numpy’s polyfit function is my favorite. (More about that in another article.)
Pandas
To analyze data, we like to use two-dimensional tables – like in SQL and in Excel. Originally, Python didn’t have this feature. Weird, isn’t it? But that’s why Pandas is so important! I like to say, Pandas is the “SQL of Python.” (Eh, I can’t wait to see what I will get for this sentence in the comment section… ;-)) Okay, to be more precise: Pandas is the library that will help us to handle two-dimensional data tables in Python. In many senses it’s really similar to SQL, though.

With pandas, you can load your data into data frames, you can select columns, filter for specific values, group by values, run functions (sum, mean, median, min, max, etc.), merge dataframes and so on. You can also create multi-dimensional data-tables.
That’s a common misunderstanding, so let me clarify: Pandas is not a predictive analytics or machine learning library. It was created for data analysis, data cleaning, data handling and data discovery… By the way, these are the necessary steps before you run machine learning projects, and that’s why you will need pandas for every scientific project, too.
If you start with Python for Data Science and you learned the basics of Python, I recommend that you focus on learning Pandas next. These short article series of mine will help you: Pandas for Data Scientists.
Matplotlib
I hope I don’t have to detail why data visualization is important. Data visualization helps you to better understand your data, discover things that you wouldn’t discover in raw format and communicate your findings more efficiently to others.
The best and most well-known Python data visualization library is Matplotlib. I wouldn’t say it’s easy to use… But usually if you save for yourself the 4 or 5 most commonly used code blocks for basic line charts and scatter plots, you can create your charts pretty fast.
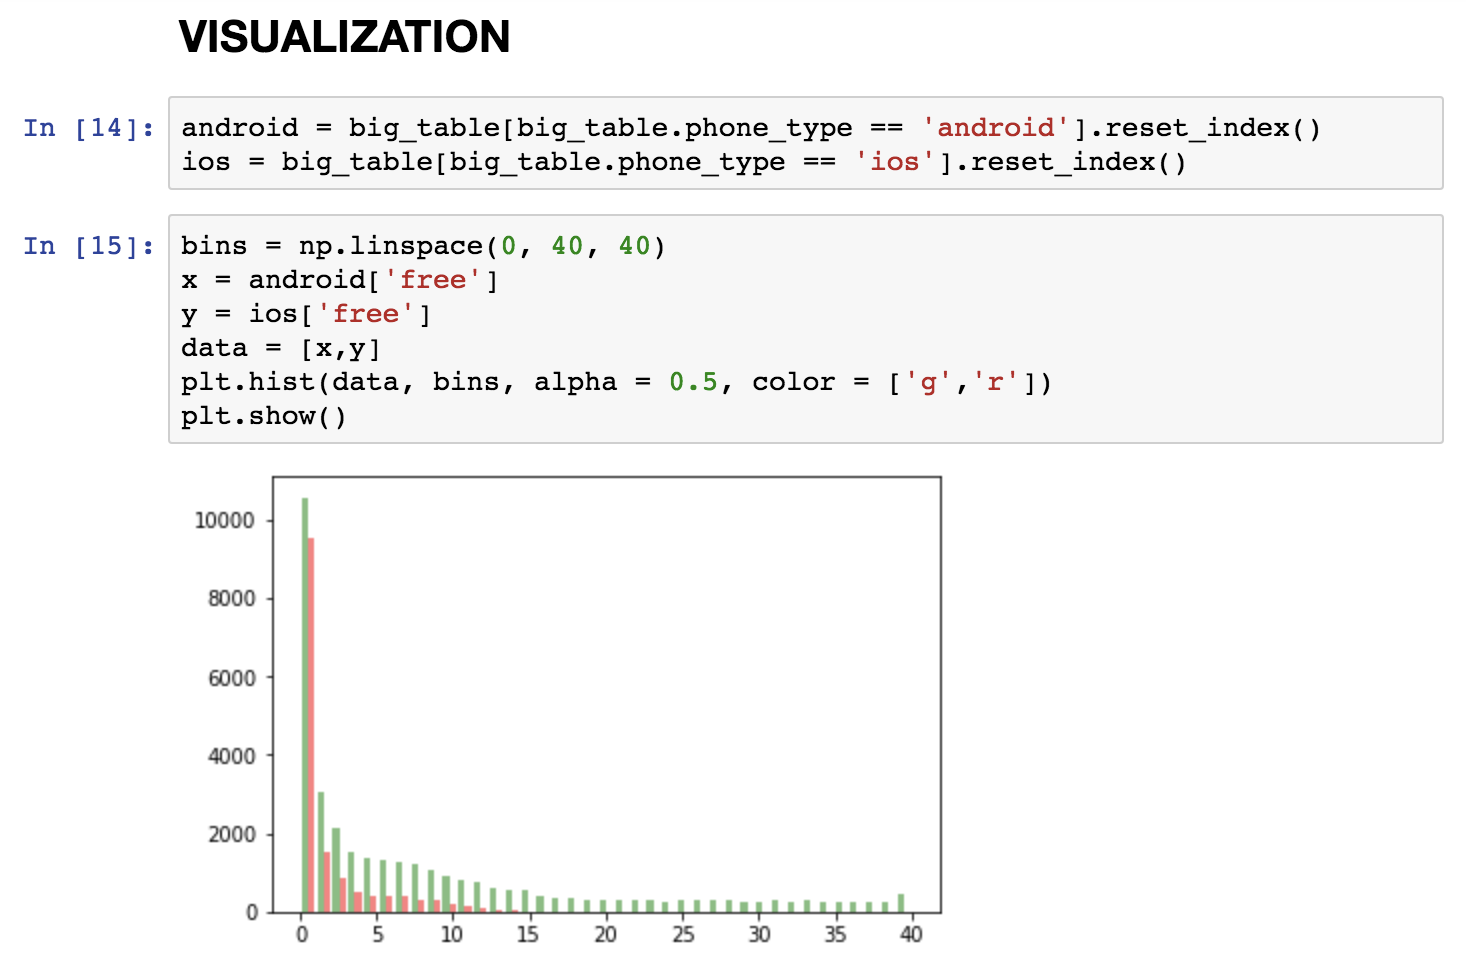
Here’s another article that introduces Matplotlib more in-depth: How to use matplotlib.
Scikit-Learn
Without any doubt the fanciest things in Python are Machine Learning and Predictive Analytics. And the best library for that is Scikit-Learn, which simply defines itself as “Machine Learning in Python.” Scikit-Learn has several methods, basically covering everything you might need in the first few years of your data career: regression methods, classification methods, and clustering, as well as model validation and model selection. You can also use it for dimensionality reduction and feature extraction.
(Get started with my machine learning tutorials here: Linear Regression in Python using sklearn and numpy!)
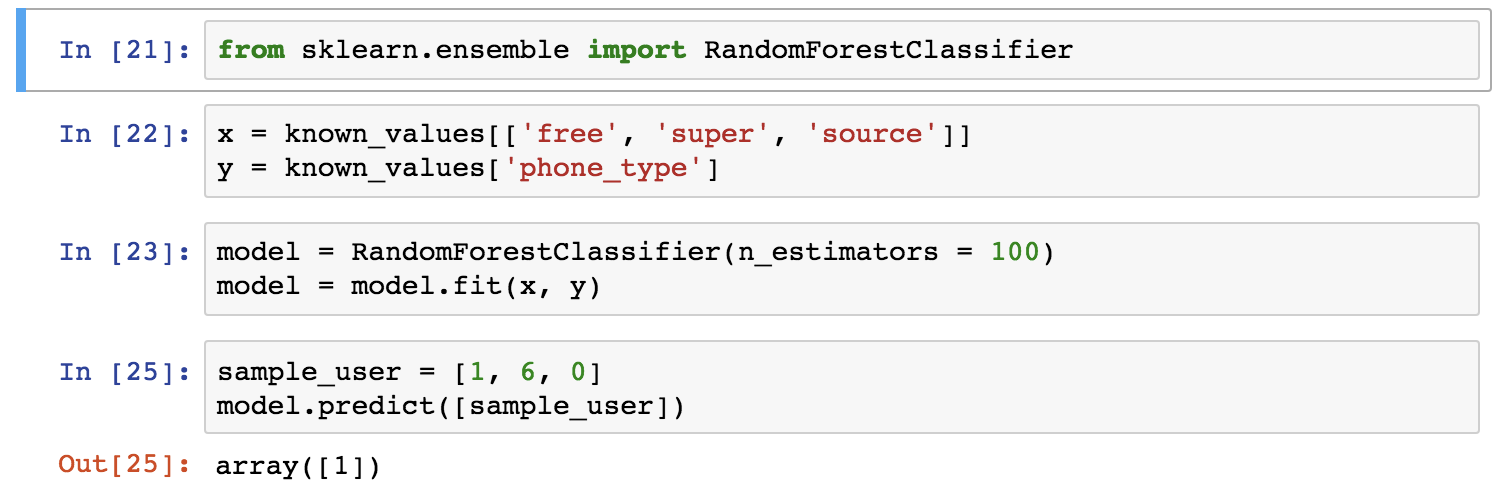
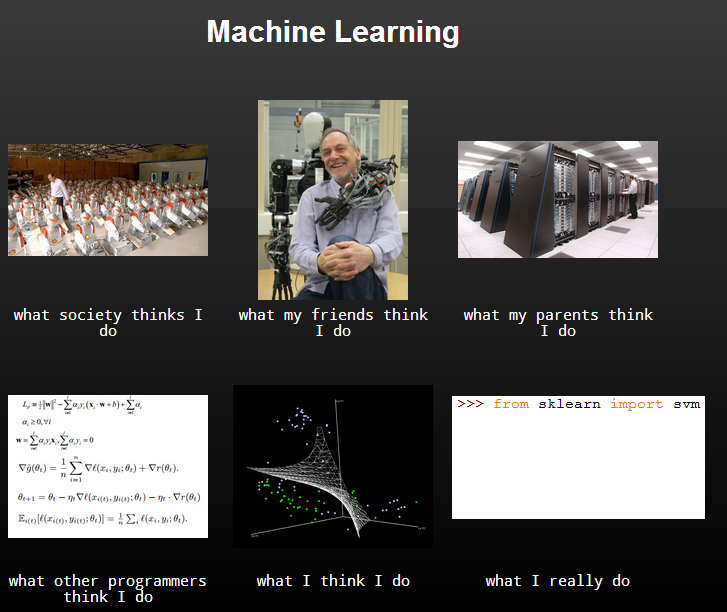
Note: You will see that machine learning with Scikit-Learn is nothing but importing the right modules and running the model fitting method of them… That’s not the challenging part – it’s rather the data cleaning, the data formatting, the data preparation, and finding the right input values and the right model. So before you start using Scikit-Learn, I suggest two things. First – as I already said – master your basic Python and pandas skills to become great at data preparation. Secondly, make sure you understand the theory and the mathematical background of the different prediction and classification models, so you know what happens with your data when you apply them.
Scipy
This is kind of confusing, but there is a Scipy library and there is a Scipy stack. Most of the libraries and packages I wrote about in this article are part of the Scipy stack (that is for scientific computing in Python). And one of these components is the Scipy library itself, which provides efficient solutions for numerical routines (the math stuff behind machine learning models). These are: integration, interpolation, optimization, etc.
Just like Numpy, you most probably won’t use Scipy itself, but the above-mentioned Scikit-Learn library highly relies on it. Scipy provides the core mathematical methods to do the complex machine learning processes in Scikit-learn. That’s why you have to know it.
The Junior Data Scientist's First Month
A 100% practical online course. A 6-week simulation of being a junior data scientist at a true-to-life startup.
“Solving real problems, getting real experience – just like in a real data science job.”
More Python libraries and packages for data science…
What about image processing, natural language processing, deep learning, neural nets, etc.? Of course, there are numerous very cool Python libraries and packages for these, too. In this article, I won’t cover them because I think, for a start, it’s worth taking time to get familiar with the above mentioned five libraries. Once you get fluent with them, then and only then you can go ahead and expand your horizons with more specific data science libraries.
How to get Pandas, Numpy, Matplotlib, Scikit-Learn and Scipy?
First of all, you have to set up a basic data server by following my original How to install Python, R, SQL and bash to practice data science article. Once you have that, you can install these tools additionally, one by one. Just follow these five steps:
- Login to your data server!
- Install numpy using this command:
[UPDATE: you don't have to install numpy, on Ubuntu 24.04 it's already installed] - Install pandas using this command:
sudo apt-get install python3-pandas - Upgrade Scipy:
[UPDATE: you don't have to install scipy, on Ubuntu 24.04 it's already installed] - Install scikit-learn using this command:
sudo apt-get install python3-sklearn
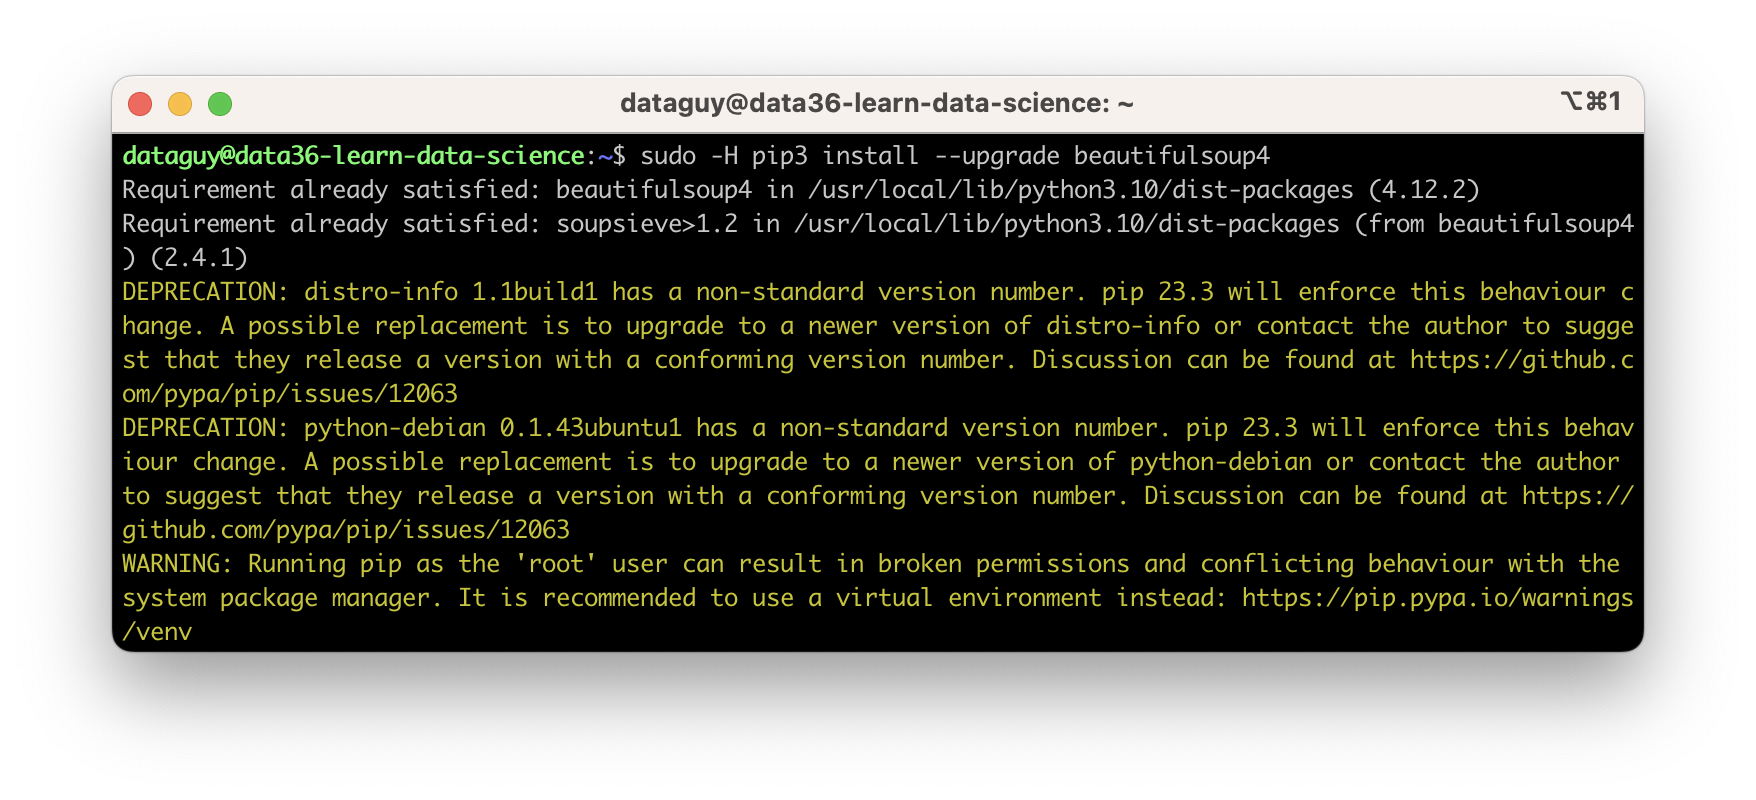
Important! During the installation process, you might see warnings, like this one below. (Lot of yellow text.) Don’t worry about them, you can just ignore them for now:
Once you have everything installed, import these new libraries (or specific modules of them) into your Jupyter notebook by using the right import statements. For instance:
import numpy as np
import pandas as pd
import matplotlib
import matplotlib.pyplot as plt
%matplotlib inline
from sklearn.linear_model import LinearRegression
After this you can even test pandas and matplotlib together by running these few lines:
df = pd.DataFrame({'a':[1,2,3,4,5,6,7],
'b':[1,4,9,16,25,36,49]})
df.plot()
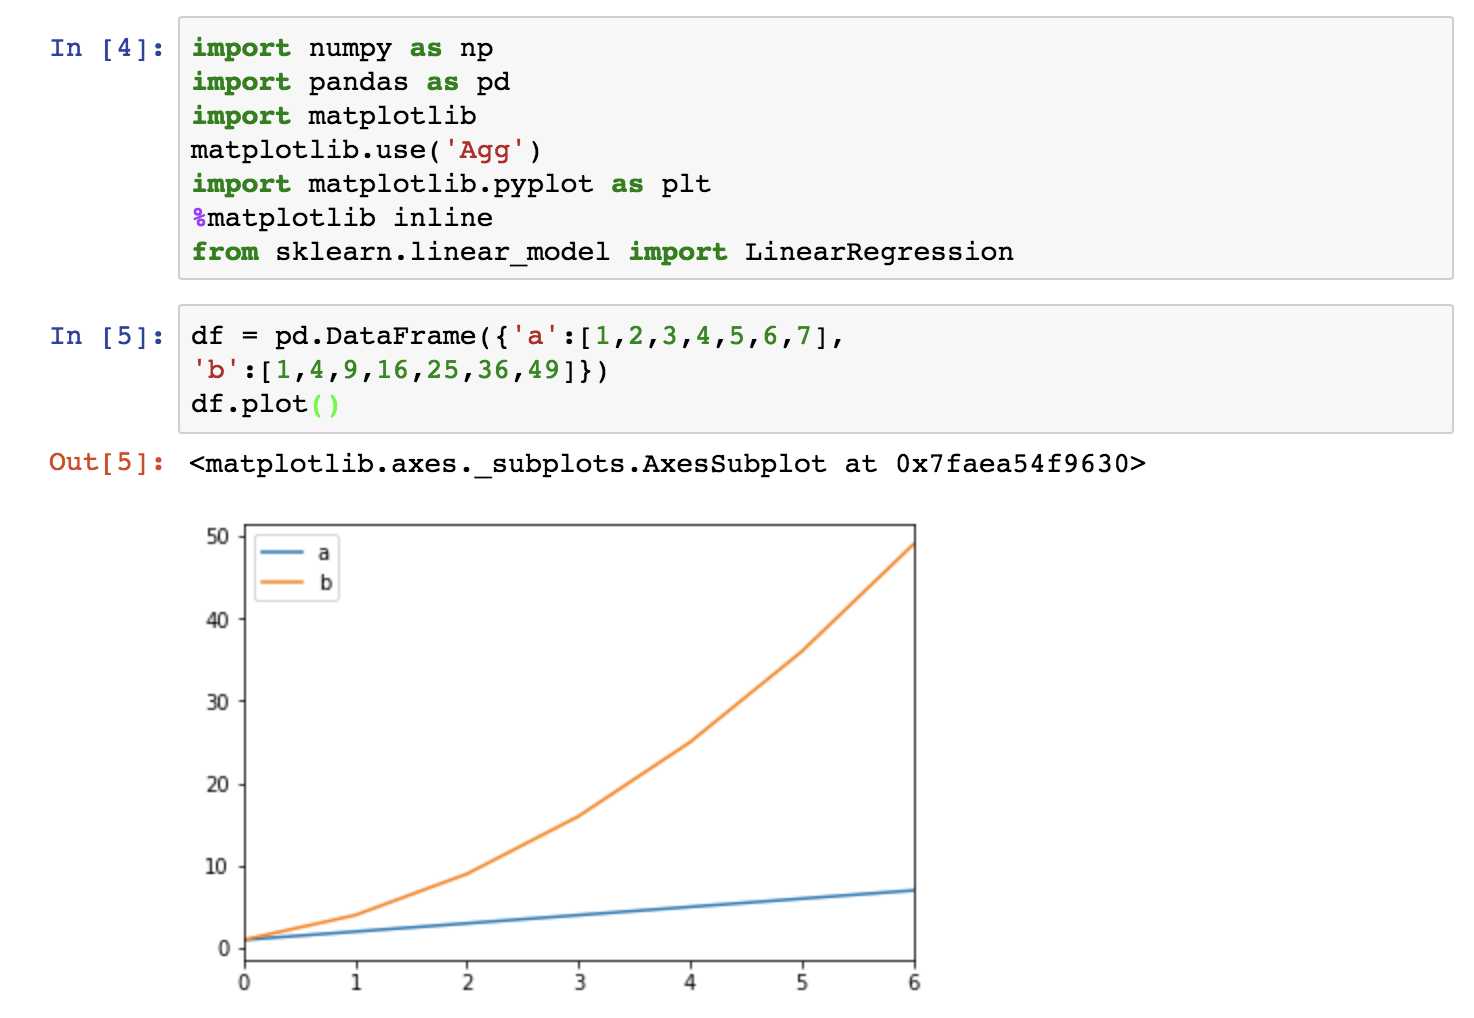
If you see this, you’ve done everything correctly! Great job!
Conclusion
The five most essential Data Science libraries and packages are:
- Numpy
- Pandas
- Matplotlib
- Scikit-Learn
- Scipy
Get them, learn them, use them and they will open a lot of new doors in your data science career!
- If you want to learn more about how to become a data scientist, take my 50-minute video course: How to Become a Data Scientist. (It’s free!)
- Also check out my 6-week online course: The Junior Data Scientist’s First Month video course.
Cheers,
Tomi Mester
Cheers,
Tomi Mester

