
In this article I’ll answer a very simple question: What is data science?
Well, the question is simple, sure… But the answer is rather complex.
The problem is that there are no generally accepted definitions. But in this article, I’ll show you many important aspects of data science. And by the end, you’ll have a pretty clear mental picture about what it is exactly!
[New] The video version of this article
Do you prefer watching this in video format? Here you go:
What is data science?
A broad definition
What is data science? A broad definition would be something like this:
You have a large amount of data and you’re trying to extract something smart and useful from it.
That’s abstract, I know… Maybe a bit of an oversimplification, too.
So here’s an everyday example to help you understand it.
Note: It’ll be an everyday example intentionally, but read it carefully and you’ll see the business parallels, too!
Okay, let’s see it!
An everyday example
I’m sure you have seen smart watches — or maybe you use one, too. These smart gadgets can measure your sleep quality, how much you walk, your heart rate, etc.
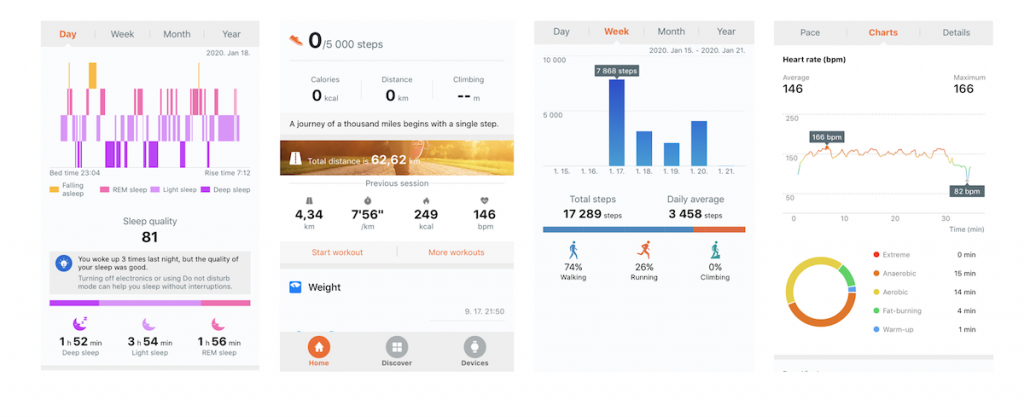
Let’s take sleep quality, for instance!
If you check every single day, how did you sleep the night before, that’s 1 data point for every day. Let’s say that you enjoyed excellent sleep last night: you slept 8 hours, you didn’t move too much, you didn’t have short awakenings, etc. That’s a data point. The day after, you slept slightly worse: only 7 hours. That’s another data point.
By collecting these data points for a whole month, you can start to draw trends from them. Maybe, on the weekends, you sleep better and longer. Maybe if you go to bed earlier, your sleep quality is better. Or you recognize that you have short awakenings around 2 am every night…
By collecting the data for a year, you can create more complex analyses. You can learn what’s the best time for you to go to bed and wake up. You can identify the more stressful parts of the year (when you worked too much and slept too little). Even more, you might be able to predict these stressful parts of the year and you can prepare yourself!
We are getting closer and closer to data science… Let’s go even deeper!
Not just trends — correlations, too!
If you have enough data, you can discover not only trends but correlations, too!
You can check out, for instance, how your sleep quality is affected by how much exercise you got in the given week. (Walking, running, biking, swimming, etc. These can also be measured by smart watches.) A simple correlation would be to see this: on the days you took more than 5,000 steps, your sleep quality was excellent. This is more than an analysis… This can be the basis of an action plan: let’s walk at least 5,000 steps every day!
Note: Although, I have to mention that in real life, a data scientist does much more research to get to a conclusion like this one.
And there are even more levels.
More data = more correlations
Just imagine the data that the producer of this smart watch can collect. In theory (let’s not consider legal aspects for now) they could see all the data of all their customers. And with that, they can produce analyses of their data that you – a single customer – could never even imagine.
Can the symptoms of depression be mitigated by walking 3,000 steps a day for most people? Are people really healthier in some countries than in others? Can weather conditions strongly impact certain social movements? And there are many, many more interesting questions. And these companies might already have enough data points to research these.
Note 1: Most of them are probably doing research around these questions already.
Note 2: Let’s not talk about the legal and ethical aspects of these things here. While these are incredibly interesting and important questions, they’re a whole article by themselves.
So as you see: the more data (and the more detailed data) you have in a data science project, the more complex, exciting and useful analyses and predictions you can create.
In essence, this is what data science is about.
Except that all these can’t only be done with smart watches and by individuals.
But with many other tools that produce and collect data — in many other fields of life…
Data science is growing rapidly in these fields…
Data science, of course, conquered the world of online businesses first.
Why online businesses? Because that’s the #1 place where you can collect data about every single movement of a user. (Some companies, of course, abused this opportunity. But again: we won’t dive into the legal and ethical aspects in this article.)
Also, parts of data science have been present in different social sciences for decades!
And in the last few years, it’s started to gain a foothold in fields like:
- manufacturing/production
- agriculture
- logistics
- politics
- automotive
- and more…

Okay, so far I’ve written about how data science can be useful.
Let’s talk about what skills and tools you need to do data science!
What is data science? From the aspect of the skills you need to do it…
If you have ever read my blog, I’m sure you’ve seen this Venn diagram:
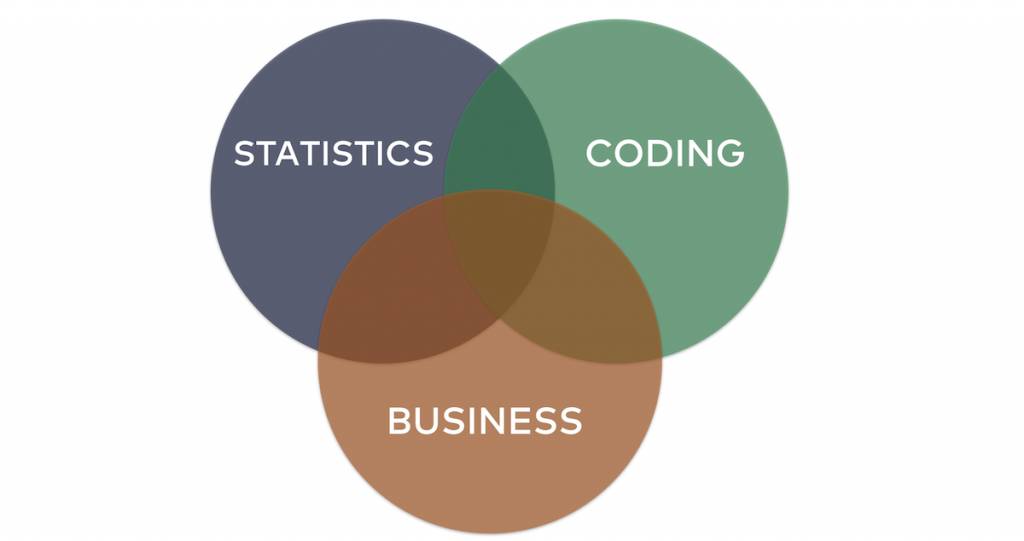
I show it quite often — and it’s really important.
It says that if you want to be a data scientist, you have to be good at three things:
- Statistics
- Coding
- Business
Why are they so important?
1. Coding
Coding is inevitable, because that’s the tool you need to work with your data. It’s like the piano for the pianist, the brush for the painter, or the pen for the poet. If you want to make your ideas come true, you have to know and use your tools as a professional. (The most popular data science languages are: SQL, Python and bash. I write about all of them on my blog. You can also get access to free cheat sheets and video courses by joining the Data36 Inner Circle.)
2. Statistics
Statistics is the actual science of your data science projects. After all, data is about numbers. And when you work with numbers, you should be confident with mathematical and statistical concepts, right?
I know that many people are afraid of (or even more: they hate) statistics. But statistics is not boring nor extremely difficult. It’s only that it has bad marketing. 🙂 To become a data scientist, you have to be familiar with statistical concepts like: statistical averages, statistical biases, correlation analysis, probability theory, functions — machine learning algorithms, of course — and so on…
3. Business knowledge
The third topic is business knowledge. This is a soft factor. For example, let’s say that you are working for a bank as a Data Analyst. You can be the best coder and the best statistician, but if you don’t understand the business concept behind interest rates or how mortgages work, you will never be able to deliver a meaningful data analysis. I wrote more about the business aspect of data science in this article: Data Science for Business.
So data science is an intersection of three things: statistics, coding and business.
Note 1: Of course, to be successful in the long-term in data science, you have to build other soft skills like: presentation skills, project management skills or people skills.
You can learn more about how to become a data scientist by taking my free course. You also can download all my Python, SQL and bash cheat sheets if you join the Data36 Inner Circle.
What about all the buzzwords? (Machine Learning, Artificial Intelligence, Deep Learning, Predictive Analytics…)
I wish I had a dollar for every time mainstream media (e.g. news portals, magazines, even conferences) misinterpret the different data-science-related terms.
- What is machine learning?
- What is artificial intelligence?
- What is deep learning?
- What is predictive analytics?
- What is data analysis?
Well, in everyday use they are buzzwords. 🙂
But they have real meanings — and a certain place within the field of data science, too. So it’s time to clarify what means what.
What is data analysis?
Usually, you will use your data for 3 major things in your data science projects:
- Data analysis (e.g. reporting, optimization, etc.)
- Predictive analytics (predicting the future)
- To build a data-based product (eg. a self-teaching chatbot, a recommendation system, etc.)
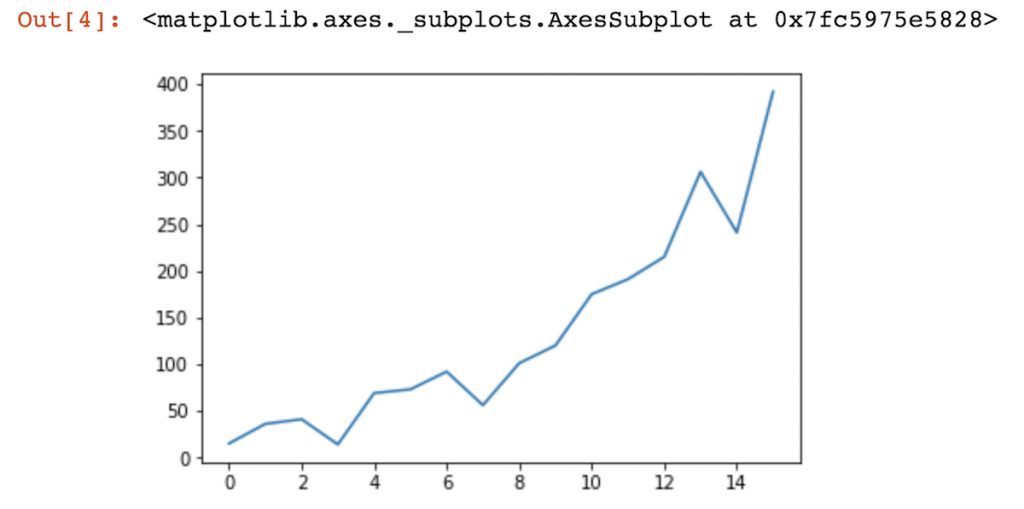
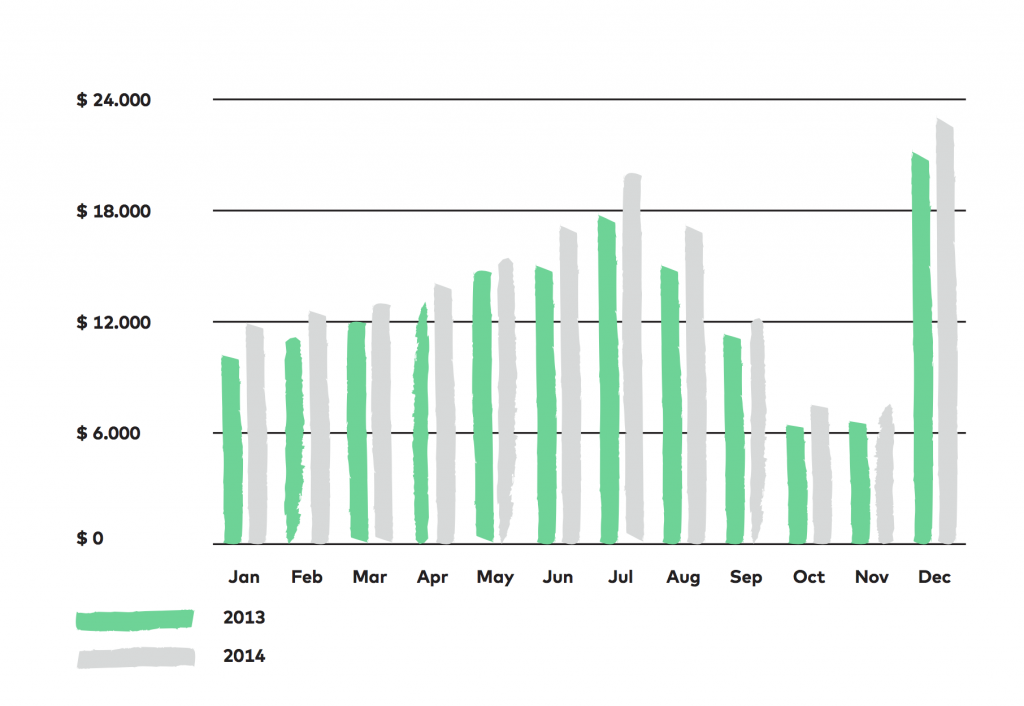
The word data analysis refers to the most conventional way of using your data. You run analyses to understand what happened in the past and where are you now. Let’s say you have this chart outlining the first 16 months of your product sales:
What is predictive analytics?
Now, predictive analytics refers to projects where you use the same historical data that you see above… but this time you try to predict the future. So you’ll answer the “what will happen” question. Let’s use the same dataset (blue line) — to estimate how your product sales will do through the 20th month (red line):
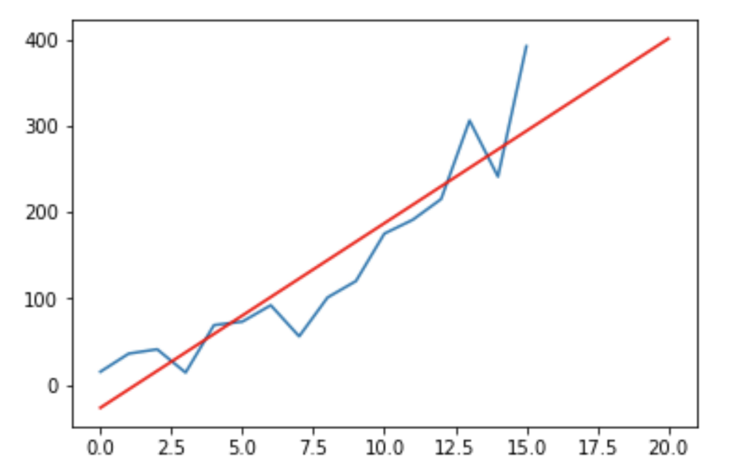
That’s a prediction.
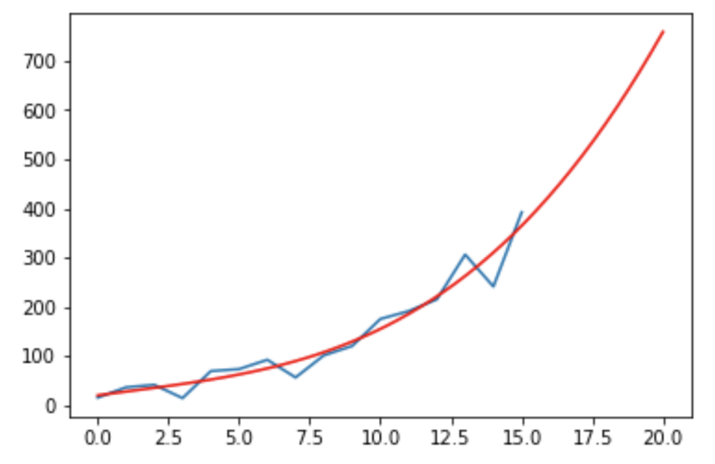
However, it’s not really accurate, is it?
Is this model better:
Or is there an even better one? Any of these maybe?
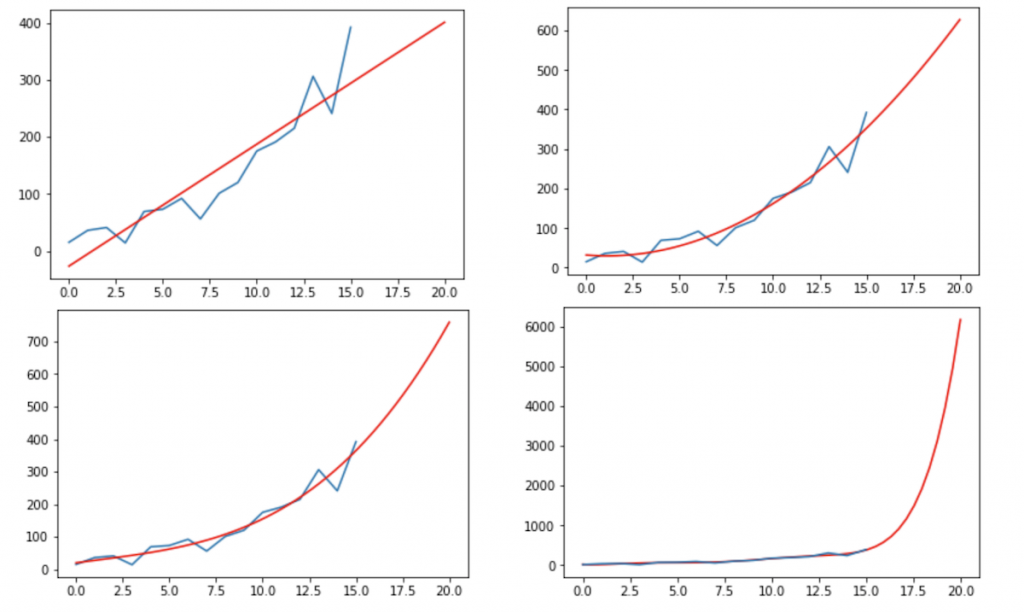
When you ask the “what is data science” question, most data scientists would say that – at least – this is where the science part of it starts.
But this is really just the tip of the iceberg…
What is machine learning?
When a computer fits the lines on the above examples, it tries to find a mathematical formula (red line) that describes well enough the relationship between the real-life data points (blue line) — that have a natural variance anyway.
Now you might ask: how the heck can computer find that mathematical formula?
By using Machine Learning.
Machine Learning is the general name for all the methods by which your computer fine-tunes a statistical model and finds the best fit for your dataset. And the blue-line-red-line example is only one of many. There are tons of machine learning methods for all the different typical data science problems. This “model fitting” machine learning method is called regression – or more precisely: linear and polynomial regression. But there are classification problems (popular machine learning algorithms: decision tree, random forest, logistic regression, etc.), clustering tasks (popular machine learning algorithms: K-Means Clustering, DBSCAN, etc.) and many more.
I won’t go into detail here — but I will write more about these on Data36. So stay tuned!
What is Deep Learning?
Actually, I’d like to talk about one particular machine learning method.
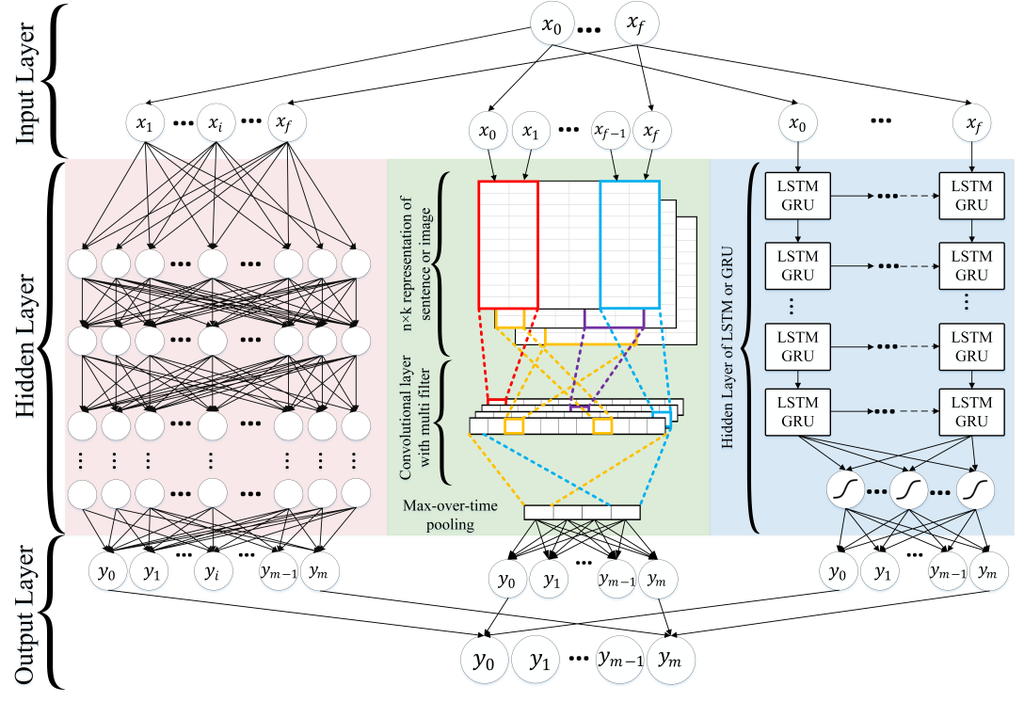
It’s called deep learning and it’s gotten very popular in the last few years… but many still don’t know what it is and what it is good for.
Deep learning is nothing but one specific machine learning method. As I mentioned, there are a lot of machine learning models and all of them are good for solving different data science problems. Deep Learning is only one of them — that’s recently been widely used for image and voice recognition projects. The way it works is quite interesting, by the way. It gets input values and it turns them into output values after filtering through many layers by creating automatic correlations. It works very similarly to how the human brain works. (More about deep learning in another article.)
Note: The best explanation of deep learning that I’ve heard so far was by Andrej Karpathy, Director of AI at Tesla. In his presentation, he introduced how Tesla cars learn to drive. He also explained the general concept of deep learning — and he showed how they are using it. It’s part of a bigger presentation, and you can find the full video here — Andrej’s talk starts at 1:52:05 and ends at 2:24:55.
What is Artificial Intelligence?
Oh, boy.
…
Well, I wrote a long paragraph about incompetent wannabe data professionals, clickbait journalists and ignorant managers (who read articles from those clickbait journalists)… and of course, companies who try to market their simple data-based products with the “AI” tag (that recently sells everything)… But I just deleted it because I don’t want to offend anyone. 🙂
It’s enough if you know that AI doesn’t exist — yet. And if humanity does ever create one, it won’t happen in the next few years. Right now, there is no computer that would be capable even of imitating creativity, intuitions, ambitions, inspiration or anything else that makes us human.
Sure, there are very advanced bots – like the one that Google presented in mid-2018. (Check out the video here.) But if you think about it – it’s nothing but a combination of an advanced chatbot, an advanced voice recognition software (like the one that you have in your smartphone) and an advanced speaking engine.
Note: Plus, you have to know that most of these bots work only in very narrow situations. As soon as they fall off their script they are useless. Also, show me a bot that has its own ambition to learn Chinese or Spanish because it feels that it will be important for its career… 😉 Right? Today’s “AI” is not even close to real human intelligence.
Data Science Project Examples
Okay, you get the theory. But how will all these get useful and profitable for your business? There are so many ways… that it could barely fit this article.
But I’ll leave here five examples to give you a few ideas, at least. (As this is an introductory article, I’ll start with these simpler ones. But I’ll add more, later. If you want to get notified, subscribe to my newsletter!)
Example #1: E-commerce + Data Science (simple example)
The first example is a classic data project in a classic online business.
Let’s say that you have an e-commerce business and you want to create reports for internal usage. (Many companies are doing this, by the way — although whether they are doing it right is a whole ‘nother article.)
In a project like this, the goal is always to help the decision makers and managers see more clearly before they make an actual decision. The job of the data scientists and analysts is to provide analyses, reports and charts supporting these folks.
The data scientist goes and checks out what happened in the last weeks, months or years. What are the trends? What changed? What is the typical customer journey? What can we expect in the future based on the data from the past? And the management makes decisions based on these.
Let’s say that we see that people are buying more and more red socks — and fewer and fewer yellow T-shirts. Obviously, you’ll try to align your offers with these trends.
This is a dead simple example of using data in a business — yet, done right, it can provide a lot of value.
Note: I mean, it’s simple to talk about. Putting it into practice is always harder. The devil is in the details, you know…
Example #2: E-commerce + Data Science (advanced example)
The second example is a slightly more advanced and complex data science project.
We’re looking at the very same e-commerce company as before. But now, let’s focus on the advertising costs. For the sake of simplicity, let’s talk about Google Ads only.
Let’s say, we get a question from management: what should our budget be in the next quarter for Google Ads? It’s not so simple to set the right value!
If the budget is too high, that’s not good because we will overspend and the profit will start to go down. If the budget is too low, that’s not good either because then we don’t spend enough money on advertising, sales go down, so does income, so does profit.
Got the problem?
Here’s where data science comes into play!
Finding the balance = better profitability
The data scientist will know how to estimate the optimal spending limit that results in the most profit.
I mean, at many companies, a senior marketing manager can do this, as well — based on best practices and industry benchmarks… even in spreadsheets! And sometimes with pretty great results! But data science offers an even better and more precise solution: by using machine learning and predictive analytics!
Let’s see the case:
The data scientist of this company will work with data from the last few years. This can include cost, income, website traffic, sales, and many other input variables. Using these data points from the past, the data scientist tries to fit a machine learning model to the dataset. She will get a mathematical model that she will be able to use creating a super accurate prediction — and eventually an optimal budget for the next quarter.
This is great because it’s more accurate compared to the “manual,” human-created predictions. But it’s also more scalable! You can always make these things more complex by including 6-8-10 more marketing channels where you can spend money on advertising. A human would struggle with maintaining an overarching view of all these. For a computer and a machine learning algorithm, that’s just another few variables in the formula.
Okay, I’m not saying that every company should build their advertising budgets on data science and machine learning… But there’s a certain size and complexity above which it is extremely profitable.
Example #3: Grocery store (FMCG sector) + Data Science
My third example is a grocery store’s data project.
Food is usually not a long lasting product, right?
I’ve heard this from a friend who works for a well-known grocery giant as a data scientist: For big grocery stores and food companies, predicting how much of different products they should order and stock is a huge challenge.
It’s the same dilemma as in the previous example: if they order too much food, it goes bad on the shelves. If too little, they won’t have supply and their shoppers will be dissatisfied… or even worse: go to a competitor.
Either way: they realize a loss. The only way to win is to find the perfect balance!
The solution for this problem can again be a fine-tuned predictive analytics model — that makes predictions based on past data. This can be done based on multiple input variables by using mathematical models. Once you can predict the demand, it becomes much easier to align the supply.
A well-known data-driven FMCG player: Walmart
By the way, data science is quite popular in this segment. For instance, there are numerous cool stories about how Walmart predicts trends and finds correlations between different variables in their business. Unfortunately, I can’t find trustworthy resources on this topic, so I don’t know whether Walmart has really done these or these are just urban legends… But one thing’s for sure: with the technology we have in 2020, these data science projects could be done easily.
One of the most popular stories was that Walmart found correlations between weather data and sales. They’ve seen that when huge storms are coming, their customers start to buy more raincoats, flashlights… and beer! So data says: when the weather goes really bad, next to the flashlight stocks, they’ll have to double up on beer supplies, too.
There are multiple combinations of these case studies — with correlations between diaper and beer sales — or predicting a customer being pregnant before she even knows, and so on…
As I said, we don’t know whether these stories are true or not.
But it’s certain that Walmart sells millions of products in thousands of stores all over the world. That means lots and lots of data points — in other words: a great opportunity to create business value using data science.
Example #4: Youtube recommendation engine (aka the “up next” video)
My 4th example is one that you, too, might know very well: the recommendation engine of Youtube.
Every time you watch a Youtube video, in the top right corner, you’ll see a recommended next one.
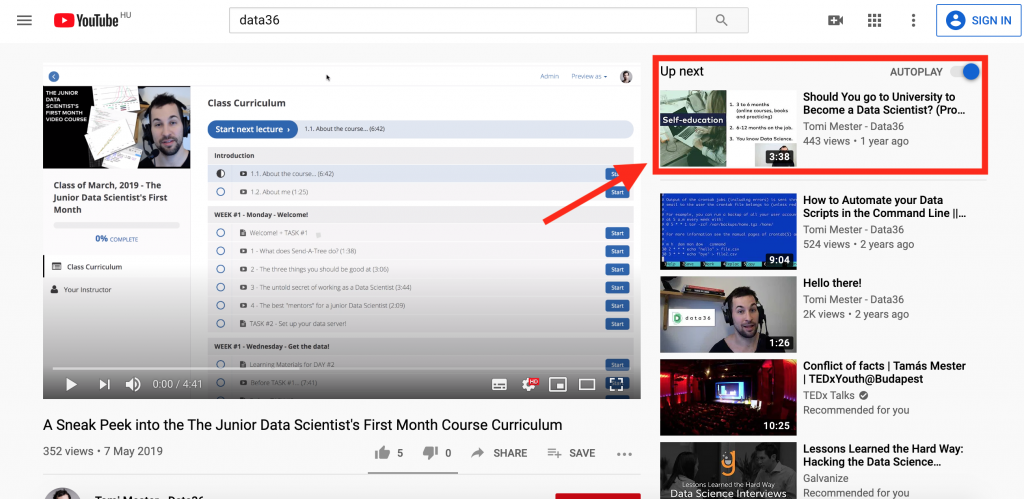
This is totally automatic and data-driven. Youtube uses a method called collaborative filtering to do it. In a nutshell, it works like this:
- They check out what videos you have watched before.
- Then they check out other Youtube users who watched the same videos as you.
- They list what other videos these other users have watched.
- And your next recommended video will be the one that those other (similar to you) Youtube users watched right after the video you are watching right now.
The theory sounds simple, right? The actual implementation of a recommendation engine like this one is rather complex, of course.
But this is just another great example of how data science can help businesses to keep their users, visitors and listeners on their website. I have to add that almost all media platforms use similar methods: Spotify, Netflix, some news portals and so on.
Example #5: Robots, “AI,” self-learning machines, etc…
My last example is something that’s a bit further from the small and medium business segment. It’s self-learning robots… Check this guy out:
Pretty crazy. And this is a video from 2017! They’ve only gotten smarter since.
Note: If you haven’t heard of them, the company who produces these machines is called Boston Dynamics.
As you see, these robots are surprisingly intelligent and skillful. And the greater part of their intelligence comes from data science and machine learning. Image and sound recognition engines, self-learning algorithms, neural networks and many more advanced data science concepts move and improve these machines.
And, of course, Boston Dynamics is not the only company that experiments with these futuristic technologies. Self-driving cars, human-like robots and many other inventions are based on the very same principles.
More’s coming!
These were just five simple examples to give you a taste of how data science can be good for a business… some of these are directly usable by small and medium businesses, others can serve as inspiration for the future.
Note: if you have any real life examples to share, don’t hesitate to drop me an email!
So what is data science?
I hope that the above helped you to clarify what data science is.
As I said, there are no generally accepted definitions, but I hope that:
- the everyday example (with the smart watch)
- showing the major components of data science (coding, statistics and business)
- explaining the main concepts (data analysis, predictive analytics, machine learning, artificial intelligence, deep learning)
- and listing a few business examples
…will help you to see data science in context.
There are many layers of it and I tried to show you as much as I can in this article.
I hope you enjoyed it — and if you want to learn more, join the Data36 Inner Circle!
- If you want to learn more about how to become a data scientist, take my 50-minute video course: How to Become a Data Scientist. (It’s free!)
- Also check out my 6-week online course: The Junior Data Scientist’s First Month video course.
Cheers,
Tomi Mester
Cheers,
Tomi Mester