
Doing Data Science without a sense of business is like playing chess without the kings on the board. For every business, making its products or services better is the ultimate goal of a data science project. Leaving that out of the picture is nonsensical.
Your data team could feature the best coders and the best statisticians, but if they don’t know the actual business application of their data projects, the whole thing will be pointless.
The business data science mindset
Did you notice that I wrote that the goal is to improve the quality of the product or service and not to generate more profit? This doesn’t mean that you won’t make more money because of your data science projects. I rather want to highlight the priorities.
On a high level, you can achieve two things with data science.
#1 Understanding your audience better. Learning about their needs, their struggles, their motivations, their habits and their relationships to your product or service.
#2 Using this understanding to create a better product or service and turning that into profit.
The order is important.
Your number one priority should be to help your users. As a consequence of that, your product or service will flourish. And that better product or service will bring you more users, more returning users and eventually more revenue.

If you like this mindset, you will like this article. If not, then maybe it’s not for you.
Note: I wrote this article mostly for online businesses. If you are not running an online business, you can still make the analogies and apply the things you learn here to your own specific use case.
A data science project step-by-step
From data to information – and from information to better decisions
At its core, (almost) every data project plays the same role in your business. Data science helps you make easier, faster and better decisions.
As simple as it sounds as complicated it can get in real life.
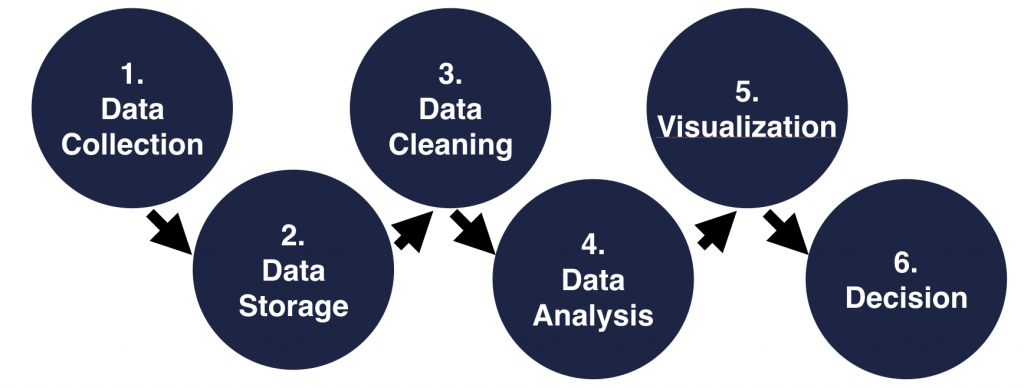
Let’s take a look at the typical six steps of a data science project:
- Data Collection
- Data Storage
- Data Cleaning
- Data Analysis
- Communication, data visualization
- Data-driven Decision
Every step has its own challenges. Let’s go through them one by one so I can show you the major challenges you should be aware of at each step – to prevent or solve them.
(1) Data Collection – where many businesses fail already
“Garbage in, garbage out.” – as the well known data principle says. And it’s true.
Too many data projects fail at this very first step. Too many companies collect incomplete, unreliable data and everything they do after that… is just messed up.
Real story from a real company: we were doing an A/B test as the last phase of a 2-month comprehensive study. It was a complex experiment, with many funnel steps and webpages included. It should have run for 30 days to collect enough data points for a statistically significant result…
The only problem was that around the end of the second week of the experiment, a freshly hired junior developer removed one of our tracking codes from one of the webpages we tested. (He said he didn’t know what the code snippet did, so he deleted it. I was fuming. I still am when I recall this story.)
The point is: we realized only at the end of the 30-day test period that the code was removed. Even though it was only one minor subpage (the issue caused an estimated ~5-10% data discrepancy), we had to trash the whole A/B testing project and restart it from day one because half of the experiment was based on skewed data.
The worst thing in this story was not that we had to re-run an A/B test – but that we could never trust our data again. We always had to double-check and triple-check everything before we made conclusions. And that slowed us down for months.
The moral of the story is: proper tracking and data collection is crucial for every business doing data science. My specific recommendation is to have at least one person in your team who’s responsible for data collection and who double-checks everything to do with it at least once a month.
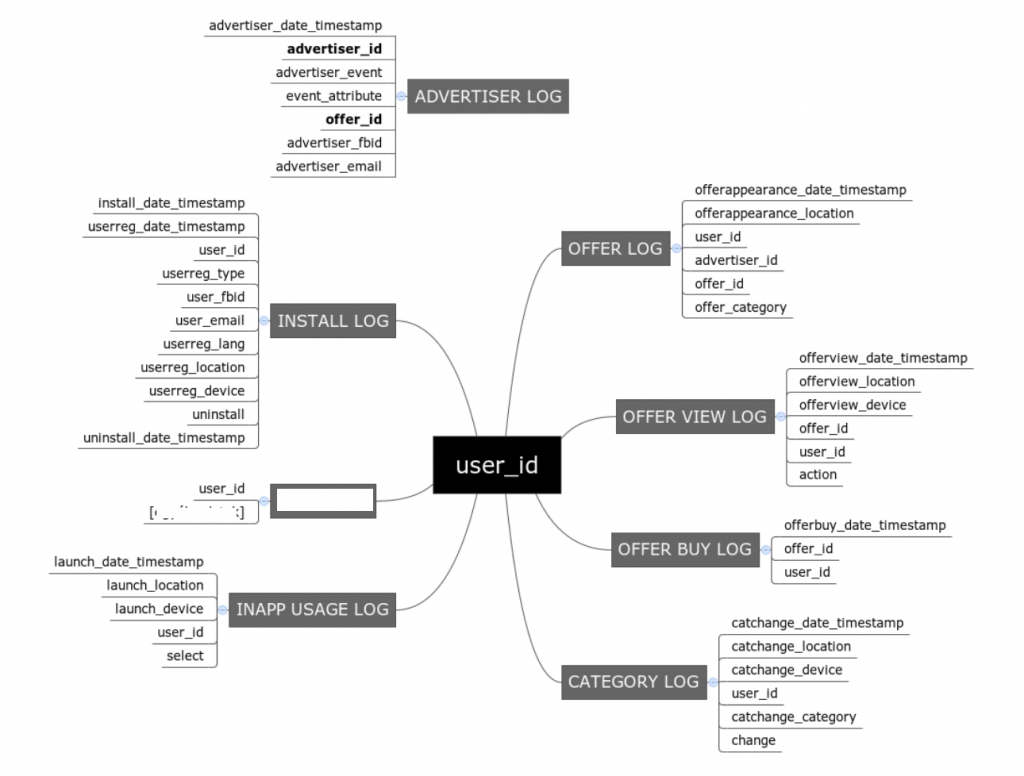
What to collect?
I get many questions about what to collect and what not to collect. I’ll get back to this in detail in an upcoming article. My general answer until then: it depends on many things.
At the companies I’m working with, we almost always do workshops to figure out what we need to collect and how.
The general idea is to collect everything you can – because data storage is relatively cheap nowadays.
But you have to keep in mind that the more things you track on your website:
- the more engineering time you should allocate to implement and maintain tracking
- the slower your website or application will be (we are talking about microseconds here – but it can add up easily)
- the more complex your data infrastructure becomes
- and so on…
Note: also consider legal and ethical aspects!
(2) Data Storage and (3) Data Cleaning – automate it and don’t forget to maintain it
Data storage and data cleaning are the responsibility of data engineers. It’s a highly technical job but usually you don’t have to worry about it too much. Not that it’s easy or unimportant. It’s just that it’s a well-defined job, so when you hire a (good) data engineer, she will know exactly how to take care of this part of your data business. There are not too many pitfalls. Plus, a big part of it can be automated, so it’s very convenient.
Although this is not a major threat for your business, I have a story where a (data scientist) friend of mine came to his office in the morning, opened his laptop… And realized that they had just lost around 40% of their historical data overnight.
I was in their office that day, and I can tell you: I’ve never seen data engineers that stressed. Ever. (By the way, the problem was an unexpected software update that caused an important data cleaning script to break.)
Luckily, they were smart enough to prepare for this event and they had backups of their historical data on other servers.
Still, this spotlights very well that data storage and data cleaning is a project that you should continuously maintain — and a place you should be prepared for “crisis situations,” too.
Big Data
One more thing about data storage… This is the right place to talk about “big data.”
It’s a common buzzword in business data science. Many books have a catchy title featuring “Big Data.” Many journalists are using it in thinkpieces. Many managers like to say it…
Dan Ariely put it right:
“Big data is like teenage sex: everyone talks about it, nobody really knows how to do it, everyone thinks everyone else is doing it, so everyone claims they are doing it…”
Dan Ariely
What really is big data?
First of all, it’s a technical concept.
Let me add another story to explain what it is. (It will also help you figure out when you need it.)
At a startup I worked with, we had around ~100,000 users when we first set up our automated data cleaning and analytics scripts. A few scripts ran every midnight, and when we arrived at the office, the updated numbers had automatically been added to the company dashboards.
All very nice and clean.
However, the company grew fast.
Fast forward 2.5 years: we had ~10,000,000 users (that’s 100 times more users), much more complex data logs (because we wanted to collect more detailed data), many more automated data scripts (because we wanted to monitor more things)… in one sentence: our data servers had to deal with an exponentially and continuously growing workload.
Until one day, we got to the office and our new daily numbers didn’t show up on the dashboards. We took a look at the scripts — and they were still running. Even though we used a very powerful (and expensive) server to do all the computations and our scripts were written to be very efficient, they ended up running for more than 10 hours.
And that’s when big data technologies come into play. The concept of big data is to connect more than one computer to manage all these computations. Depending on your company (and data) size, it can easily be a cluster of 10, 100 or even 1000 computers. Sounds easy, but under the hood, using big data can be very challenging from a technical standpoint.
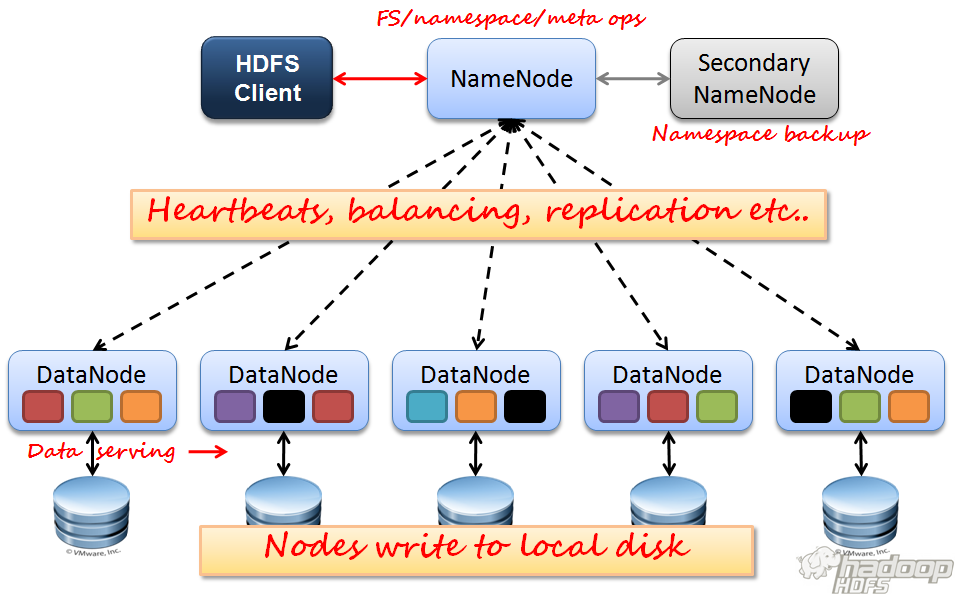
Anyway, that’s what big data is in a nutshell.
Again: it’s highly technical and if you hire good (big) data engineers, they will know what to do.
Note: if you want to learn more about the technical part, the keywords you want to google are “apache spark” and “apache hadoop”.)
(4) Data Analysis – extracting value
This is where business data science gets exciting – for business people at least.
A data analyst is a sculptor.
She gets a block of data and then she carves and carves until she gets something truly special.
And it’s a creative process, indeed.
I’m a data analyst at heart and I know from experience that when you have an ocean of data in front of you, it can be very intimidating.
Often, you don’t know where to start.
But there are a few guidelines that can help. Here are the top three that helped me:
1. Good questions.
To get useful answers, you have to ask the right questions. That usually comes from the management (or other colleagues), who already have suspicions based on their experience.
In this case, a data analyst’s primary job is to prove or disprove these suspicions (let’s call them hypotheses).
Note: A common misbelief is that disproving a hypothesis is a step backwards. People are looking at it as the failure of an idea… That’s the wrong mindset, though. When a good data analyst proves or disproves an idea, she discovers many new things throughout the process, so she can offer one or more alternative solutions that are better than the original idea.
Let me also emphasize the good in the phrase “good question.” Answering bad questions sets back a data project significantly. Bad questions can be:
- Unimportant questions (“What happens if we change the logo size by one pixel?”)
- Questions that aren’t business related.
- Vague questions (“How do people like us?”)
- Or questions that we don’t (and won’t) have data to answer.
2. Qualitative research.
Often, when I don’t know where to start with my data analysis, I go to the UX department of the company I’m consulting for and take a look at their usability test results. Also, I really like to sit in on usability tests (or watch the recordings).
There is nothing like seeing a real user interacting with your product. Watching just 5-6 UX tests will give you at least 10-20 ideas for where to start your analytics project.
3. Best practices.
Now that I’m a more experienced data analyst I know quite a few data analysis techniques that it’s worth starting my research with.
It really depends on the given data project and on the specific business use case.
But at online businesses I usually start my discovery process with a funnel analysis, a segmentation or a retention analysis project. (More about this in later articles.)
If you start with business analytics today
If you start with data science for your business today, I’d recommend focusing on one specific thing before you do anything else.
That’s finding your single most important metric.
You’ll find as many names for this as there are books on the subject:
- OMTM – One Metric That Matters (by Croll & Yoskovitz)
- WIG – Wildly Important Goal (by McChesney & Covey)
- North Star Metric (by Sean Ellis)
- Etc.
Different names, same point:
You have to figure out your single most important metric.
And you should place this metric above every other metric you have — measure it and keep it as your main focus.
A good most important metric is:
- simple (so everyone at your company understands it immediately)
- measurable (so it’s an actual number)
- describing your business goals really well (so it actually matters)
and… - There is only one of it! (Yes, I know, it’s hard to find one metric. But it’s possible — and once you have it, it will be very useful!)
(Note: Actually there are a few more factors that make a good main metric… but let’s try to meet these four conditions first!)
Let’s take the simplest example: a mature e-commerce business.
What makes the best number one key metric for an online e-commerce business that’s been operating for more than 10 years?
Of course, it’s revenue! Why? Because it’s simple. (Profit, for instance, would be much harder to calculate and understand for everyone at your company.) It’s easy to measure. It reflects on the company’s business goals. And it’s one single metric. Perfect.
The situation is simple for mature e-commerce businesses. At other businesses (e.g. early phase startups, more complex business models, etc.), it can be much harder to figure it out. For many of my clients, finding the single most important metric takes multi-hour-long internal workshops.

But so far everyone has been able to find it. So can you!
(5) Data Communication – data and information translated for business people
This is the step where most data science projects fail.
Interesting, isn’t it?
You can be the best analyst working with the finest data set in the world… But if you can’t communicate your findings efficiently, you will have zero impact.
That’s the nightmare of every data professional.
There are quite a few roadblocks here. And I’ve seen all of them: data-sceptic (or simply stupid) co-workers, over-complicated presentations, unreadable charts…
The fact is that everyone at your company needs to be involved in order to build a culture where people can communicate and use data.
I have two specific recommendations for you:
- Educate!
Data professionals should hold presentations every week – not just about their recent findings but also about why data science is important for the company. Start with things like what a data analyst does, how the data science business works, how colleagues can build self-serving data solutions for themselves, and so on.
Business people should educate data scientists, as well. They should help them to create and deliver better presentations. I’m really grateful for the companies I worked with, because they sent me to presentation trainings regularly. Plus my managers also sat down with me to review my presentation before I presented it to the whole company – so we could make sure that I really nailed it on stage. It helped a lot for everyone. - Keep it simple.
Everything about your communication should be as simple as it can be!- No fancy scientific words (you don’t want to show off),
- no complicated charts (you don’t have to show everything),
- no infinite emails (you want people to read what you write).
If you can show your data-driven takeaways in one line chart and explain them in one sentence, you should do it. Everyone will be happy about it.
Note: I wrote more about data presentation principles in this article: Presentation Tips for Data Professionals.
(6) Data-Driven Decision Making – why are data-driven managers important?
Have you ever heard the acronym “HIPPO”?
It stands for highest paid person’s opinion… and it was a well-established business decision-making method for decades…
Thanks to data science, it’s not the case anymore.
However, not every manager is ready for this to change. Even a very well-executed data project can (and will) fail at this point, just because you hurt someone’s feelings or ego. I know this sounds bad but this is the inconvenient truth. (Especially at larger companies with 500+ employees.)
You can prevent this by establishing a data-driven company culture early on. (I usually recommend to start to think about your data strategy when you have 10-50 employees.)
At a bigger company, it will be exponentially harder to make your organization data-driven.
It’s also important to send your managers to data workshops and make sure that they develop the right mindset.
Business Data Science = Compressing 10 billion data points into one “yes” or “no”!
Here are the six steps of an online business’s data science project again:
- Data Collection
- Data Storage
- Data Cleaning
- Data Analysis
- Communication, data visualization
- Data-driven Decision
Can you see how it’s all about compressing the infinite amount of data into a single yes-or-no decision?
It’s like distilling the essence from a meadow of flowers.
It takes hard work but it’s rewarding in every sense.
If you manage to collect the right data and use it well, you will be able to make better decisions more quickly and more easily. That will lead to a better product, happier customers and eventually more revenue.
And that’s what business data science is all about.
The 3 Major Data Science Business Applications
I want to talk a little bit more about STEP (3) Data Analysis, because it’s a very broad topic.
There are so many opportunities to turn your data into value.
More specifically, at online businesses, these are the three most common practical applications of data science:
(A) Business Analytics (aka Descriptive Analytics).
It answers the questions of “what has happened in the past?” and “where are we now?”
(E.g. reporting, measuring retention, finding the right user segments, funnel analysis, etc.)
(B) Predictive Analytics
It answers the question, “what will happen in the future?”
(E.g. early warning (predicting which user will cancel her subscription next month), predicting the marketing budget you will need in the next quarter, etc.)
(C) Data-Based Product
A product that works using your historical data.
(E.g. self-learning chatbots, recommendation systems, image recognition, voice recognition, etc.)
Which one of these brings the most business value?
To answer this question, your keyword is:
ROI – Return on Investment.
From a purely business perspective, data science is an investment of your resources, and you want to have some sort of return on it.
The question is: which project of the above three brings the biggest value for your business right now?
Business analytics? Predictive Analytics? Or developing a data-based product?
It’s an open question and one to which only you know the answer. But here’s a common pattern I see from my clients all the time.
Everyone is very excited about predictive analytics, machine learning and data-based products (like chatbots). Yet, many of these companies:
- don’t have a clear funnel (that they measure step-by-step)
- don’t know too much about their key metrics (not to speak of their most important metric),
- don’t have clear numbers on their important user segments
- heck, sometimes they don’t even know how many users (or paying users) they have
- and so on…
These are all (A) business analytics and descriptive analytics questions.
And until you know the answer to these questions (and other simple but important business questions), you should not go for machine learning projects yet.
If you recognize yourself, my strong recommendation is: invest in business analytics and simple reports first. By answering the basics, you will generate tremendous business value: you will see more clearly and you will understand your audience better.
And who knows, maybe by learning your audience’s needs, you will map out a user-need for an image recognition system in your product, and in a few months (when the business data science fundamentals are already set) you can start to work on that, too.
Calculate return on investment, and go for the simpler data science projects first!
Conclusion
Summarizing everything, your business data science project will have six major steps:
- Data Collection
- Data Storage
- Data Cleaning
- Data Analysis (here you can work on business analytics or predictive analytics projects — or on data-based products)
- Communication, data visualization
- Data-driven Decision
All these steps come with unique challenges, and all together they build up into a complex system. This article gave you a few practical tips and tricks — but you will learn the big picture and put everything in context when you start to build up your own data infrastructure.
It’s a difficult project but it will bring you value on every level: better product(s), happier customers and more revenue!
- If you want to learn more about how to become a data scientist, take my 50-minute video course: How to Become a Data Scientist. (It’s free!)
- Also check out my 6-week online course: The Junior Data Scientist’s First Month video course.
Cheers,
Tomi Mester
Cheers,
Tomi Mester