
Humans are stupid.
We all are, because our brain has been made that way. The most obvious evidence of this built-in stupidity is the different biases that our brain produces. Even so, at least we can be a bit smarter than average, if we are aware of them.
This is blog for aspiring data scientists, so in this article I’ll focus only on the most important statistical bias types. But I promise that even if you are not looking for a data science career (yet), you will profit a lot by reading this. For ease of understanding, I’ll provide two examples of each statistical bias type: an everyday one and one related to data science!
And just to make this clear: biased statistics are bad statistics. Everything I will describe here is to help you prevent the same mistakes that some of the less smart “researcher” folks make from time to time.
The most important statistical bias types
There is a long list of statistical bias types. I have chosen to show you only 9 of these. Why? Because these nine types of statistical bias are the most important ones. I see these to affect the job of data scientists and analysts everyday.
Here they are:
- Selection bias
- Self-selection bias
- Recall bias
- Observer bias
- Survivorship bias
- Omitted variable bias
- Cause-effect bias
- Funding bias
- Cognitive bias
Statistical bias #1: Selection bias

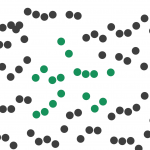
Selection bias occurs when you are selecting your sample or your data wrong. Usually, this means accidentally working with a specific subset of your audience instead of the whole, rendering your sample unrepresentative of the whole population. There are many underlying reasons, but by far the most typical I see is collecting and working only with data that is easy to access.
Everyday example of selection bias:
Please answer this question: What’s people’s overall opinion about Donald Trump’s presidency?
Most people have an immediate and very “well-informed” answer for that. Unfortunately for many of them, the source of their “research” is their social media feed. Very bad and sad practice, because what they see there does not show the public opinion – it’s only their friends’ opinion. (In fact, it’s even narrower, because they see only the opinion of friends who are active and posting to social media – so a certain segment of their friends are overrepresented.) That’s classic selection bias: easy-to-access data, but only for a very specific, unrepresentative subset of the whole population.
Note 1: I do recommend blocking your Facebook feed for many reasons, but mostly so you don’t get narrow-minded: FB News Feed Eradicator!
Note 2: If you want to read another classic selection bias story, check how Literary Digest made a similar mistake (also referred to as undercoverage bias) ~80 years ago!
Data science related example of selection bias:
Here’s another example of selection bias. Let’s say that you want to create a new product on your website. Before spending a lot of time and money, you want to know whether your audience would pay for it at all. So you send a survey out to your newsletter subscribers, right? Of course, interacting with your audience is important (I send out surveys to my Newsletter Subscribers every now and then, as well), but there’s an issue! When it gets to survey results, you should be aware that your newsletter subscribers do not represent your full audience.
There might be a bunch of people who are willing to pay for your products, but aren’t a part of your newsletter list. And on the other hand, there might be a lot of people on your list who would never spend money on your products — they are around just to get notified about your free stuff. So if you get 95% “no” and 5% “yes” answers, what does it mean? Exactly nothing. It’s a skewed and biased statistics… And that’s only one reason why surveying is simply the worst research method (see the rest below).
Note: By the way, for this particular example, I’d suggest fake door testing instead!
Statistical bias #2: Self-Selection bias
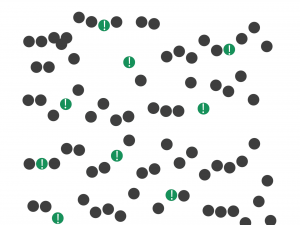
Self-selection bias is a subcategory of selection bias. If you let the subjects of your analyses select themselves, that means that less proactive people will be excluded. The bigger issue is that self-selection is a specific behaviour – that may correlate with other specific behaviours – so this sample does not represent the entire population.
Everyday example of self-selection bias:
Any type of polling or surveying. E.g. if you use surveys to research successful entrepreneurs’ behaviour, your results will be skewed for sure. Why? Because successful people most probably don’t have time or motivation to answer or even take a look at random surveys. So 99% of your answers will come from entrepreneurs who think they are successful, but in fact are not. In this specific case, I’d rather try to invite a few entrepreneurs (who are proven to be successful) for a 30-minute interview.
Data science related example of self-selection bias:
Say you have an online product – and an accompanying knowledge base with 100+ how-to articles. Let’s find out how good your knowledge base is by comparing users who have read at least 1 how-to article to the users who haven’t. You find that the article-reading users are 50% more active in terms of product usage than the non-readers. The knowledge base performs great! Or does it? In fact, we don’t know, because the article-readers are a special subset of your whole population, who might have a higher commitment to your product and thus more interest in your knowledge base. In other words, they have “selected themselves” into the reader group. This self-selection bias leads to a classic correlation/causation dilemma that you can never solve with research on your historical datasets, only with A/B testing.
Statistical bias #3: Recall bias
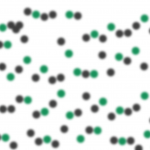
Recall bias is another common error of interview/survey situations. It happens when the respondent doesn’t remember things correctly. It’s not about bad or good memory – humans have selective memory by default. After a few years (or even a few days), certain things stay and others fade. It’s normal, but it makes research much more difficult.
Everyday example of recall bias:
How was that vacation 3 years ago? Awesome, right? Looking back we tend to forget the bad things and keep our memories of the good things only. Although it doesn’t help us to objectively evaluate different memories, I’m pretty sure our brain uses this type of bias for a good reason.
Data science related example of recall bias:
I hold data science workshops from time to time. Of course, I always send out feedback forms afterwards, so I can make the workshops better and better based on participants’ feedback. I usually send them the day after the workshop, but there was one particular case when I completely forgot and sent it one week later. Looking at the comments, that was my most successful workshop of all time. Except that it’s not necessarily true. It’s more likely that recall bias might have kicked in. One week after the workshop none of the attendees would recall if the coffee was cold or if I was over-explaining a slide here or there. They remembered only the good things. Not that I wasn’t happy to get good feedback, but if the coffee was cold, I would want to know about it so I could get it fixed for the next time…
Statistical bias #4: Observer bias
Observer bias happens when the researcher subconsciously projects his/her expectations onto the research. It can come in many forms, such as (unintentionally) influencing participants (during interviews and surveys) or doing some serious cherry picking (focusing on the statistics that support our hypothesis rather than those that don’t.)
Everyday example of observer bias:
“Breaking news!” Sensationalist articles often come from poor research. It takes a very thorough and conscientious investigative journalist to be OK with rejecting her own null-hypothesis at the publication phase. If a journalist spends one month on an investigation to prove that the local crime rate is high because of the careless police officers, she may find a way to prove it – leaving aside the counter arguments and any serious statistical considerations.
When I realized how significant this statistical bias is, I decided that I’ll doubt everything that I read in the news… And when I learned about other common types of bias, like funding bias (studies tend to support the financial sponsors’ interests) or publication bias (surprising research results tend to get published, tempting researchers to extremize them), I ended with the conclusion that reading any type of online media will never get me closer to any sort of truth about our world.
Ever since, I consume trustworthy statistics rather than online media – or even better: I try to find trustworthy raw data and do my own research and analyses to find a more unbiased truth.
Data science related example of observer bias:
Observer bias can affect data projects as well — especially when you are running qualitative research types (such as usability tests). As a user researcher, you know your product very well (and maybe you like it too), so subconsciously you might have expectations. If you are a seasoned User Experience Researcher, you will know how not to influence your testers with your questions… But if you are new to that field, make sure you spend enough time preparing good, unbiased questions and scenarios. Maybe consider hiring a professional UX consultant to help.
Note: in my workshop feedback example, observer bias is another bias type that can occur in my workshop feedback forms. Namely, when I send out the survey right after the workshop. Why? Because participants might be under the influence of meeting me in person – and might not want to “hurt my feelings” with negative feedback. Workshop feedback forms should be sent exactly 1 day after the workshop itself.
Statistical bias #5: Survivorship bias
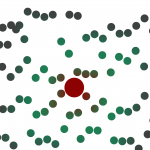
Survivorship bias is a statistical bias type in which the researcher focuses only on that part of the data set that already went through some kind of pre-selection process – and missing those data-points, that fell off during this process (because they are not visible anymore).
Everyday example of survivorship bias:
One of the most interesting stories of statistical biases: falling cats. There was a study written in 1987 about cats falling out of buildings. It stated that the cats who fell from higher stories have fewer injuries than cats who fell from lower down. Odd. They explained the phenomenon using terminal velocity, which basically means that cats falling from higher than six stories reach their maximum velocity during the fall, so they start to relax and prepare to land, which is why they don’t injure themselves that badly.
As ridiculous as it sounds, as mistaken this theory turned out to be. 10 years later, the Straight Dope newspaper pointed out the fact that cats who fall from higher than six stories might have had a higher chance of dying, and therefore not being taken to the veterinarian – so they were simply not registered and didn’t become part of the study. And the cats that fell from higher but survived were simply falling more luckily, which is why they had fewer injuries. Survivorship bias – literally. (I feel sorry for the cats though.)
Data science related example of survivorship bias:
Reading case studies. Case studies are super useful for inspiration and ideas for new projects. But remind yourself all the time that only success stories are published! You will never hear about the stories where someone used the exact same methods, but failed.
Not so long ago I read a bunch of articles about exit intent pop-ups. Every article declared that exit intent pop-ups are great and caused gains of 30%, 40%, even 200% in number of newsletter subscriptions. (In fact, it works pretty decently on my website too…) But let’s take a break for a moment. Does it mean that exit-intent popups will work for everyone? Isn’t it possible that there are businesses who have tested exit-intent pop-ups and found that it actually hurts the user experience? Or the brand? Or the page load time? And if so, would they write an article about this failed experiment? Probably not. The things is that most people simply don’t like to write about unsuccessful experiment results… They just forget it and move on to the next experiment.
The point is: if you read a case study, think about it, research it and test it – and decide based on hard evidence if it’s the right solution for you or not.
4 more statistical bias types and some suggestions to avoid them…
This is just the beginning! In the next article I’ll continue with 4 more statistical bias types that every data scientist and analyst should know about. And the week after, I’ll give you some practical suggestions on how to overcome these specific types of bias!
UPDATE: here’s Statistical Bias Types Explained – part 2
- If you want to learn more about how to become a data scientist, take my 50-minute video course: How to Become a Data Scientist. (It’s free!)
- Also check out my 6-week online course: The Junior Data Scientist’s First Month video course.
Cheers,
Tomi Mester
Cheers,
Tomi Mester