
This is third episode of my Data Coding in Bash series.
We’ve already set up a fully functioning data server, have learned the basic orientation commands and have learned the basics of data cleaning and shaping in bash.
In this article we will do the first steps with basic mathematical and statistical functions that will get us closer and closer to doing actual data science in the command line. Plus we will also start with bash scripting!
Note 1: to get the most out of this article, you should not just read it, but actually do the coding part with me! So if you are on your phone, I suggest you save this article and continue on Desktop!
Note 2: If you don’t have the data infrastructure yet, you can install it on your own in roughly 30-60 minutes: Data Coding 101 – Install Python, R, SQL and bash!
Note 3: If you haven’t read it yet, I suggest starting with the previous bash articles:
Some preparation
Just for the record! I do like pre-built statistical, mathematical and predictive analytics packages and modules, regardless of whether we are talking about Bash, Python or R. However what I do not like is a data scientist who is not 100% aware what’s happening in the background when he/she uses this pre-built stuff. I’m a big fan of learning by doing, so in my opinion the best way to make sure you understand the math behind these packages is if you actually build them yourself – at least once in your life.
Today we will do something like this.
And we will start with the easiest ones: MAX, MIN and MEDIAN.
Now back to the command line!
I have two tiny demo-data-sets for you. You can download them to your server with wget. Make sure that you are logged in to your server – and create a new folder (I’ll call it sortdemo) next to practice (practice is the folder that we’ve used in the previous bash articles), then download the demo-data-sets with wget.
mkdir sortdemocd sortdemowget https://data36.com/demo1.csv --no-check-certificatewget https://data36.com/demo2.csv --no-check-certificate
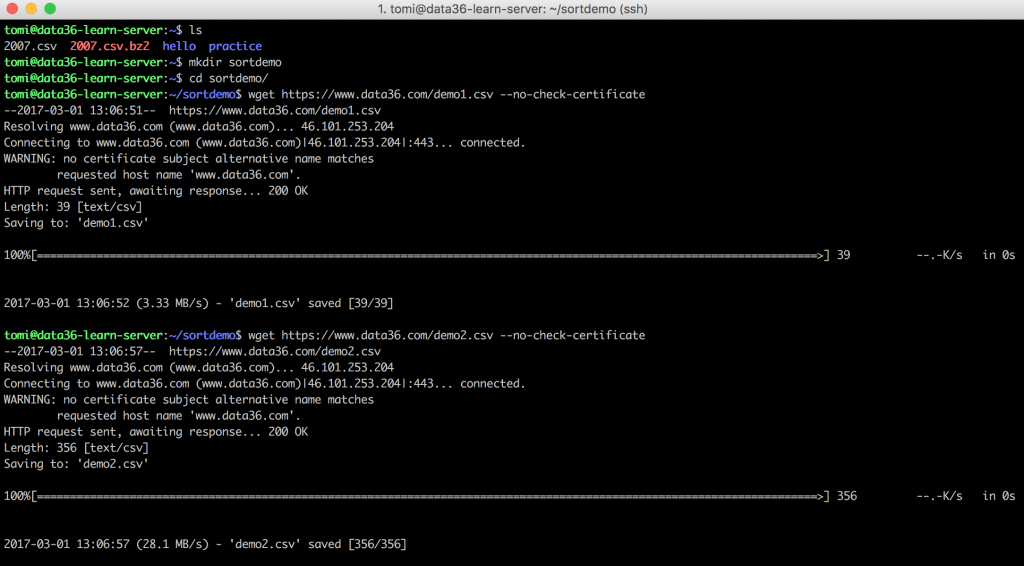
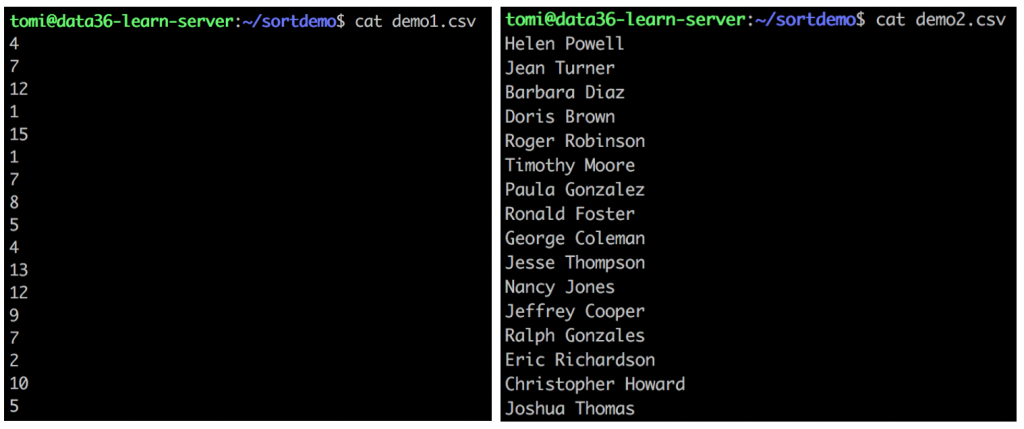
Use cat on both files and you will see that demo1.csv contains random numbers and demo2.csv random names. (Generated by a random generator by the way – so if you find your name on the list, that’s only an – epic – accident.)
Sorting in bash
There is a pretty easy-to-remember command line tool in bash to sort things with… It’s called the sort command.
First try to sort your name-list:sort demo2.csv
This is what you will get back:
Barbara Diaz
Christopher Howard
Craig Carter
Diana Hughes
Doris Brown
Eric Richardson
George Coleman
Helen Powell
James Young
Jean Turner
Jeffrey Cooper
Jesse Thompson
Jimmy Phillips
Joshua Thomas
Kathy Sanchez
Michael Bell
Nancy Jones
Paula Gonzalez
Ralph Gonzales
Roger Robinson
Ronald Foster
Stephanie Harris
Terry Henderson
Thomas Wilson
Timothy Moore
Sorted in alphabetical order. Beautiful!
Try the same on the numbers:sort demo1.csv
And the result is:
1
1
10
12
12
13
15
2
4
4
5
5
7
7
7
8
9
Hm. Not exactly the same as we learned in elementary school. The problem is that sort, by default, sorts things in alphabetical order. The method it follows is: sort by the first character, then by the second character, then by the third, and so on…

While this works really well on the names, it causes some confusion with the numbers. Fortunately you can let sort know that you want to sort numbers and not words. You should add an option: -n (“numeric-sort”). Type this to your command line:
sort -n demo1.csv
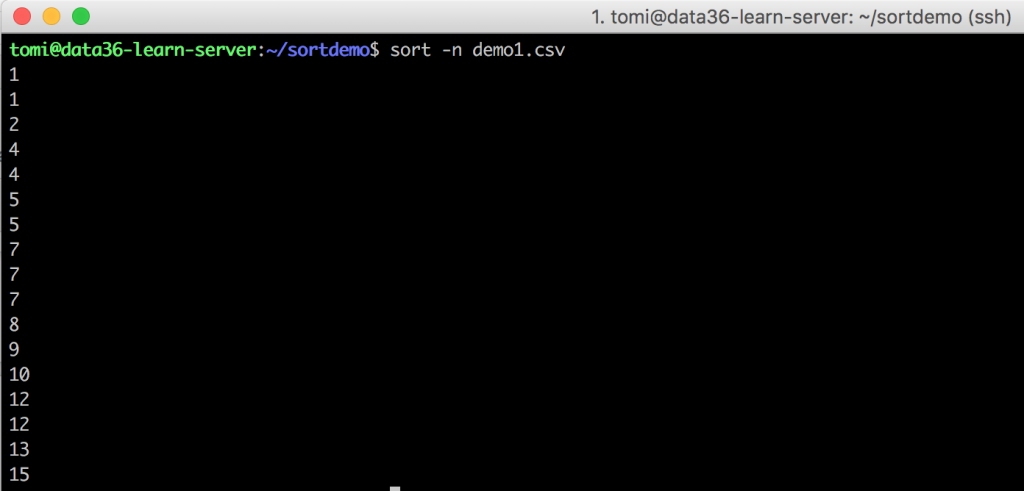
Now we are talking!
Important options for sort
Good! sort is pretty straightforward! Here are some more options that you will find handy. Try them one by one!
sort -V –» natural sort of (version) numbers within text (Note: JDS course participants, you will need this ;-))
sort -r demo2.csv –» -r means reverse. Instead of an ascending list, you will have a descending list.
sort -r -n demo1.csv –» It works with numbers as well if you add the -n option too (e.g. it could be useful for creating a top-down list).
sort -n -u demo1.csv –» Remove duplicates! It returns every repeating value only once. (U is for unique.)
sort -t’,’ -k2 -n filename.csv -–» You can’t try this on demo1.csv, but feel free to go and try it on the flightdelays.csv file. -k means “key” and -k2 tells sort that the key of the sorting should be the second column and not the first (which is the default). But as per usual, bash doesn’t know what character is separating your columns, so you should specify it with -t’,’. It’s pretty much the same thing -d’,’ did for cut. Then you might ask, why is the syntax for the same option different: -t for sort and -d for cut?
I have three answers for this:
- I don’t know. (Which is – I guess – not a real answer.)
- In
sort,-dis reserved for another option (“dictionary-order”) - The creators of
sort(Mike Haertel and Paul Eggert) are not the same people as the creators ofcut(David M. Ihnat, David MacKenzie, and Jim Meyering), so they just simply didn’t follow the same naming convention.
This is not the only time you will see inconsistency across command line tools, so it’s just better to get used to it!
Test yourself #1
Calculate MAX, MIN and MEDIAN!
Now that you have learned sort, go back to your flightdelays.csv data set.
cdcd practice
I have 3 exercises for you. All three are doable using some of the command line tools you’ve learned so far.
- What was the MAXIMUM delay in Arrivals?
- What was the MINIMUM delay in Arrivals? (Early arrivals count too, so you will probably have a negative number here.)
- What was the MEDIAN of the all the delays in Arrivals?
(Note: what MEDIAN is? Learn it here: Statistical Averages – Explained.)
Spend some time trying to answer these questions. Once you are done, continue reading and you will find my solutions.
…
…
Here they are:
Solution for MAX and MIN
MAX(ArrivalDelay) =
2598
(minutes… Which is 43 hours. I would not like to be on that plane.)
To get the result, this should be typed to the command line:cut -d',' -f15 flightdelays.csv |sort -n |tail -1
With the cut command, we can keep only the 15th column, which is ArrDelay. Then we pipe this data into sort -n. Eventually we print only the last line, which is the actual maximum value that we were looking for.
MIN(ArrivalDelay) =
-312
(which means the plane was 6 hours early.)
The approach is pretty much the same:cut -d',' -f15 flightdelays.csv |sort -n |head -1
The only thing I’ve changed is that instead of tail -1 I put head -1 at the end, which gives back the first and not the last number of the sorted column.
Solution for MEDIAN
MEDIAN(ArrivalDelay) =
0
Back to middle school: What is the median? Simply put: median is the “middle” value of a data set. E.g. take the data set: [1, 2, 3, 5, 6, 13, 100]. Sort them, then take the middle one: 5. That’s the median. If your list has an even number of elements (e.g. [1, 2, 5, 7]), then the median will be the mean of the middle two numbers (in that case (2 + 5) / 2 = 3.5).
Let’s see:
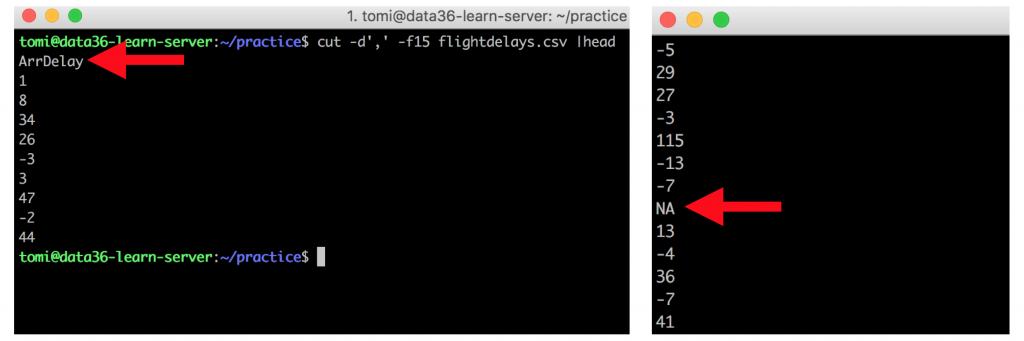
STEP 1) discover the data:cut -d',' -f15 flightdelays.csv –» Never miss this step! Keep watching your terminal screen and you will realize that you have some missing data (NA) and an unnecessary header (ArrDelay) in your data set. Both of these should be removed.
(Note: in real life data science we have tools other than just watching the screen. We are not there yet in my tutorials, but soon…)
STEP 2) Filter the garbage…
…with grep and count the lines with wc:cut -d',' -f15 flightdelays.csv |grep -v 'NA' |grep -v 'ArrDelay' |wc -l
The result is:
7275288
The median is the middle value of this list. (Make sure you sort it first.) So you should divide 7275288 by 2. It’s 3637644. And as 7275288 happened to be an even number, you need to pick the 3637644th and 3637645th values.
STEP 3) Pick the numbers:cut -d',' -f15 flightdelays.csv |grep -v 'NA' |grep -v 'ArrDelay' |sort -n |head -3637645 |tail -2
Our winning numbers are:
0
0
The Median is the mean of these two: 0.
Note: Notice how iterative bash is! We get the results in 3 steps, with little modifications of the command at each step.
Text-editor for the command line
So far we have interacted with bash only by typing different commands directly to the command line. But you can use text editor tools too. Well, it does not look exactly the same as you’ve gotten used to in Windows/Mac…
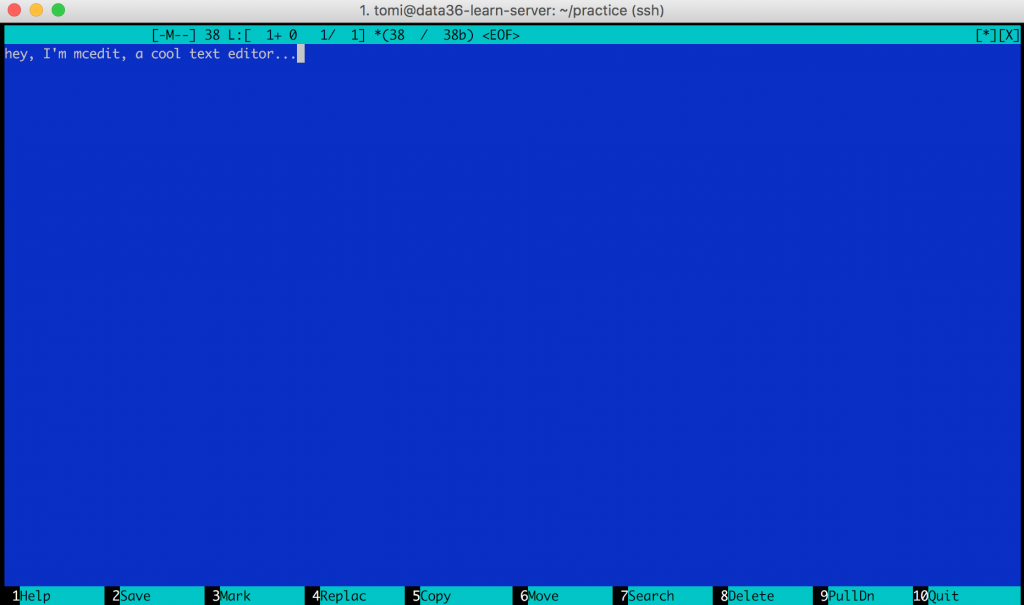
Looks really retro (hey, after all, it’s from 1994), but it will be super useful when you start bash scripting or when you want to quickly create a new text-file (or when you want to look hip in Starbucks).
Anyway. When you have set up your data server, you have also set up mcedit. If you didn’t, please do it now:sudo apt-get install mc
(Type your password. And if it asks if you want to continue, just say yes.)
Once it’s installed, open the mcedit command line tool:mcedit
Boom! Ready for text-editing! (You should see the same blue picture that I have attached above.) What I particularly like in mcedit is that you can use your mouse here (finally, back to graphical user interfaces)! So when you want to exit, you can click the “Quit” button in the bottom right corner – or when you want to search something, you can click the “Search” button on the bottom menu.
Anyway – type some text in, click the “Quit” button and save your file.
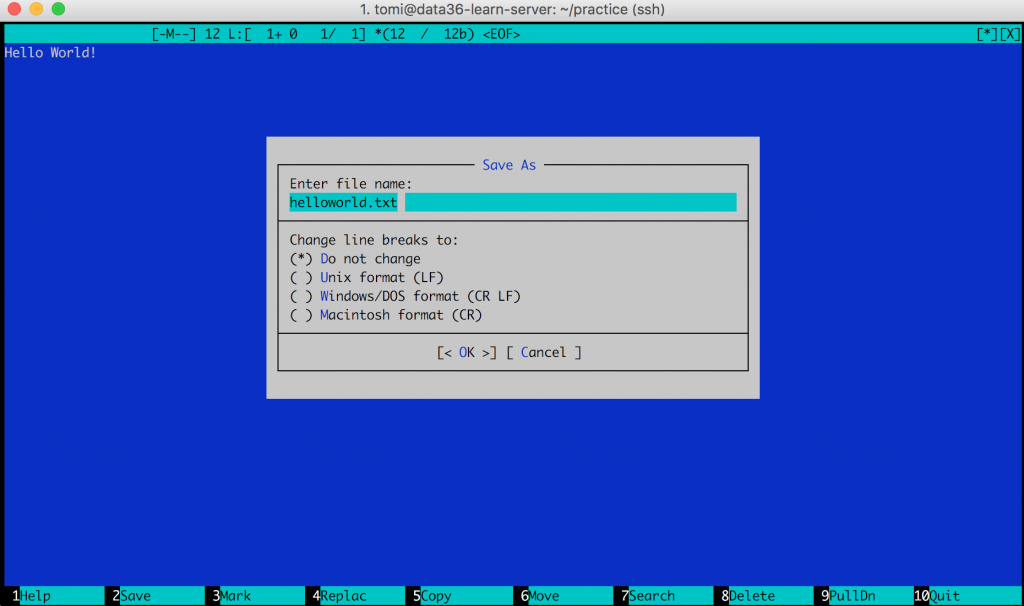
You will have a new file in your folder that you can print like every other file – with the cat command.
cat helloworld.txt
If you want to modify this file, just go back to mcedit:
mcedit helloworld.txt
Print unique values and count them!
Let’s create a new text file with some numbers in it!mcedit demo3.csv
Let’s add these numbers to your file:
1
1
2
2
2
3
3
3
2
2
2
1
1
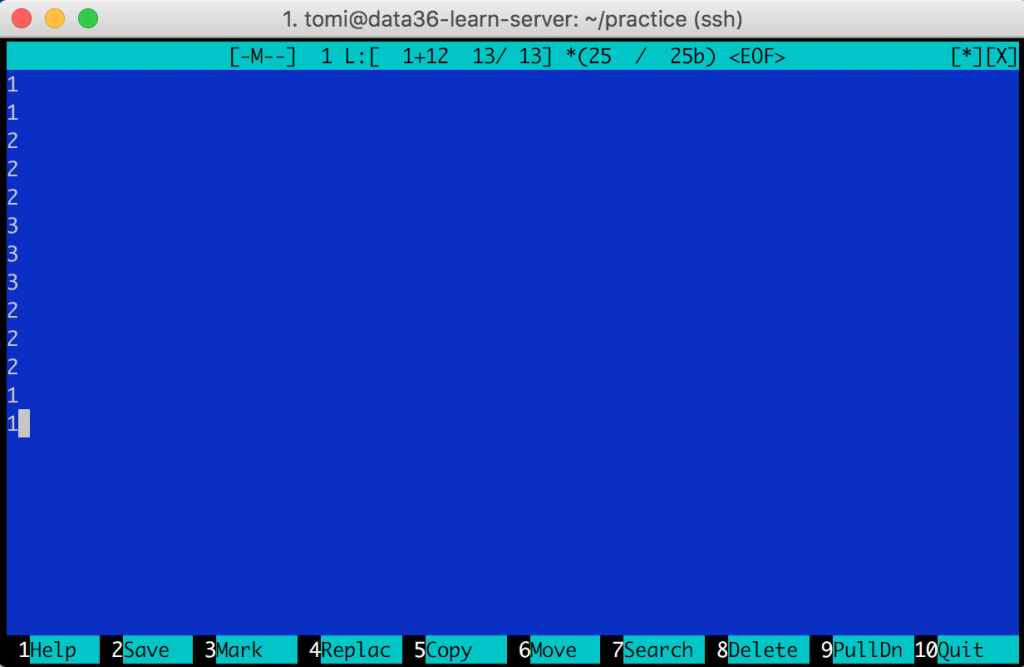
I called my new file demo3.csv (just to stay consistent with the naming of my demo files).
And here’s a new command line tool. Try it:
uniq demo3.csv
uniq unifies multiple lines. The result that you get back is:
1
2
3
2
1
As you can see, it only unifies adjacent lines. Sometimes it’s useful (e.g. when you want to remove duplicates), but in data science, we usually combine it with sort, so you can get a list of each unique value of your data set.
sort demo3.csv |uniq
It returns:
1
2
3
Note that this result is exactly the same as you would get if you typed sort -u. Type this:sort -u demo3.csv
Result:
1
2
3
So why am I showing this to you? Because uniq has some pretty cool options. Here’s the one that I use the most.
sort demo3.csv |uniq -c –» -c stands for “count”
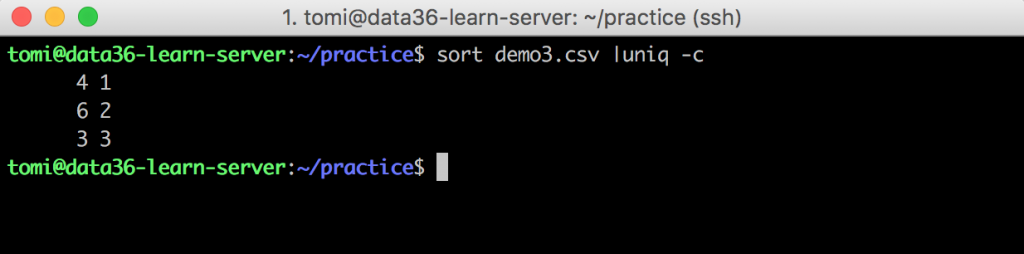
It counts the number of occurrences of every unique value in your file. We had four occurrences of 1, six of 2 and three of 3 in our data3.csv file.
Test yourself #2
How is this useful? Let’s do this exercise and you will find out!
Back to your flightdelays.csv file!
Question is: How many different destination airports do we have in our flightdelays.csv file?
..
..
Answer:
311
(well, the real answer is 310)
Code:cut flightdelays.csv -d',' -f18 |sort |uniq |wc -l
Some explanation:
First you cut the Dest(ination) column (it’s the 18th). Then you sort and uniq the airport names. Then you count the number of lines with wc -l. The result is 311, but mind that there is a header line, which you should not count. This makes the real result 310.
Test yourself #3
List out the top 3 destination airports (by the number of arriving planes)!
..
..
Answer:
297481 DFW
375716 ORD
413805 ATL
Code:cut flightdelays.csv -d',' -f18 |sort |uniq -c |sort -n |tail -3
You cut the 18th column (Dest) again. sort the results and use uniq -c to count the number of occurrence of each value. You turn this into a “top list” with sort -n and you keep the top 3 with tail -3.
You have just found out with bash + command line which airports were most frequently flown to in 2007! Now imagine that these are not airports, but users, and we are talking not about airport-landing, but feature usage… This is something that actual online data analysts do from time to time when they are doing their jobs!
Create a bash script
In data science it’s a pretty common case that you are working with live or semi-live data.
E.g. many startups run their analyses every midnight, so when the decision makers go to the office on the next morning, they can see the updated numbers and charts.
Of course it doesn’t mean that an analyst sits there and pushes the buttons every midnight. More like, smart analysts and data scientists create scripts that automatically run every midnight.
To run automatic data processes you need to do a few things:
- You have to have a remote data server. (done)
- You have to learn data coding using at least one language. (work-in-progress)
- You have to turn your commands into scripts. (coming up now)
- You have to automate them. (I’ll get back to that later)
I remember when I wrote my first bash script (which was actually my first data script as well), I was very surprised at how easy it is. A data script is nothing else but the commands – that you would type to the command line – listed one after another in a text file. That’s it.
Let’s try it out!mcedit demoscript.sh
For a start, let’s go with a very simple script – type this into your editor.
#!/usr/bin/env bash

echo "The top 3 airports:"
cut flightdelays.csv -d',' -f18 |sort |uniq -c |sort -n |tail -3

echo "The number of unique airports:"
cut flightdelays.csv -d',' -f18 |sort |uniq |wc -l
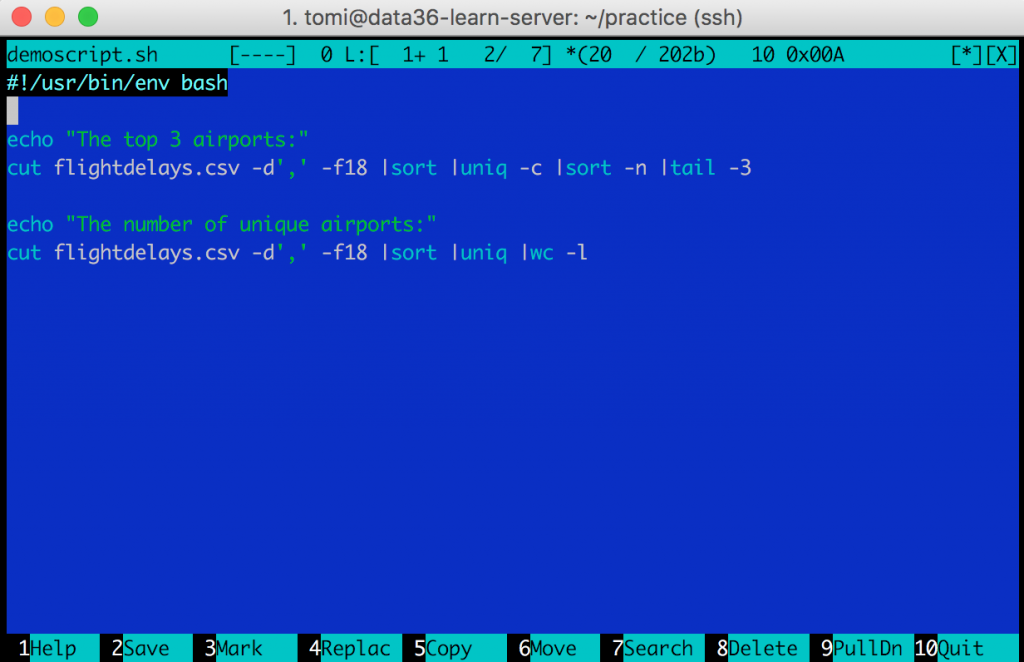
What your script will do:#!/usr/bin/env bash –» this line is called the shebang. Its only job is to tell Ubuntu that your script is in bash. (You can write similar scripts in Python, R, SQL, etc… I’ll show you how!)
echo "The top 3 airports:" –» This will print to your screen the string “The top 3 airports”cut flightdelays.csv -d',' -f18 |sort |uniq -c |sort -n |tail -3 –» You know this line.
echo "The number of unique airports:" –» Same printing function.cut flightdelays.csv -d',' -f18 |sort |uniq |wc -l –» You know this line too.
If you are done: click “10 Quit” and save your file.
Run a bash script
Your script’s extension is .sh, which stands for Shell Script. If you don’t add the .sh, that won’t cause any practical difference.
Let’s try to run your script in your folder with this syntax:./demoscript.sh
The answer will be an error message (Permission denied).
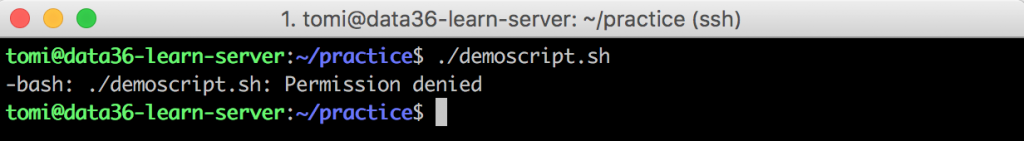
The issue is that running a script in the command line needs permission. Fortunately you can give this permission for yourself by typing this command:chmod 700 demoscript.sh
Retry:./demoscript.sh
And the magic happens:
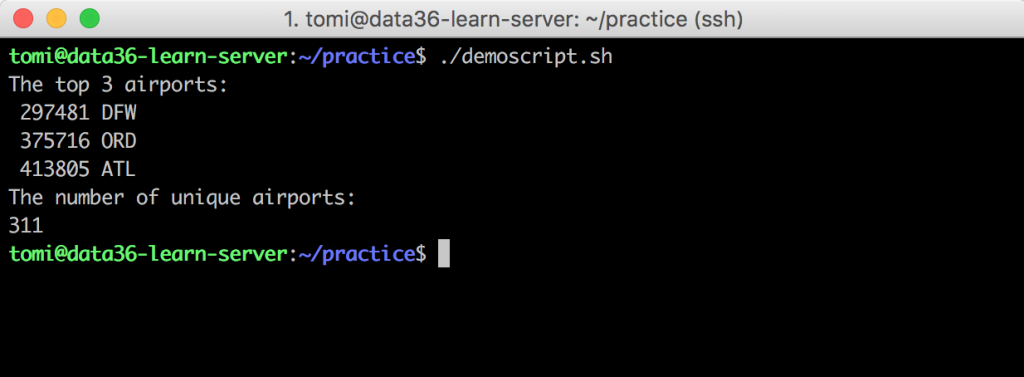
Your script executes the commands you typed line by line and gives back the results on your Terminal screen!
Well, this was just a very brief intro into bash scripting, but I guess you have already learned a lot today! 😉
(Note: Here are two examples of slightly more complicated bash scripts:
- I wrote this script when I wanted to find the best rental deal in Budapest back in 2014. It went through the website of the top Hungarian real estate portal every 5 minutes automatically and sent me an email when it found something new that fit me. I managed to find an apartment for 40% less than the market price!
- This second script is much more complex! Actually it calls other bash and SQL scripts as well. This was my first pet project back in 2012. It collects and analyzes the news from ABC, BBC and CNN. It pulls and connects the articles from the different news-portals if they are about the same topic. Finally it compares their credibility based on the wording of the articles.
Conclusion
We went through many many important things in this article. uniq and sort are very useful commands to use for actual analysis of your data. Bash scripting supported with mcedit will be a great ally of yours as well during your data science career!
In the next bash tutorial I’ll continue with the top command line tools and tricks that make data coding life easier! (Update: I released the next episode too!)
- If you want to learn more about how to become a data scientist, take my 50-minute video course: How to Become a Data Scientist. (It’s free!)
- Also check out my 6-week online course: The Junior Data Scientist’s First Month video course.
Cheers,
Tomi Mester
Cheers,
Tomi Mester