
You might have heard that Data Scientist was ranked as the best job of 2017 in the USA (based on Glassdoor’s research). Recently many IT professionals have started considering shifting their career path towards Data Science or Data Analytics. University students are looking for data related internships – even if their major is unrelated. And even project and product managers want to learn data analytics basics to make better data-informed decisions. Are you interested in learning more about the basics of data analytics too? Then this article is for you! I’ll just summarize the most fundamental topics for first timers.
Why is Data Science/Analytics important?

We know nothing either. Without data at least.
Have you ever had this experience: you’re sitting in a meeting, arguing about an important decision, but each and every argument is based only on personal opinions and gut feeling? And if you asked “why,” the only answers you’d get would be:
- “because we have done this at my previous company”
- “because our competitor is doing this”
- “because this is the best practice in our industry”
You could answer:
- “Your previous company had a different customer base and solved a different problem. Why would we use the same strategy here?”
- “If we don’t know why we are doing things, why would we suppose that our competitor does?”
- “Our world changes faster than ever. There are no industry standards anymore – just trends, and if you are the one who can react the best and the fastest to these trends, then – and only then – you’ll win.”
After all, the only real answer for the “Why do you think this is the best strategy?” question is: “Because this is what the data suggests.” And an important way to learn exactly what the data suggests is to do data analyses.
What is Data Science?
Data Science is the combination of these three skills:
- Statistics / Mathematics skills
- Coding skills
- Domain Knowledge / Business Knowledge
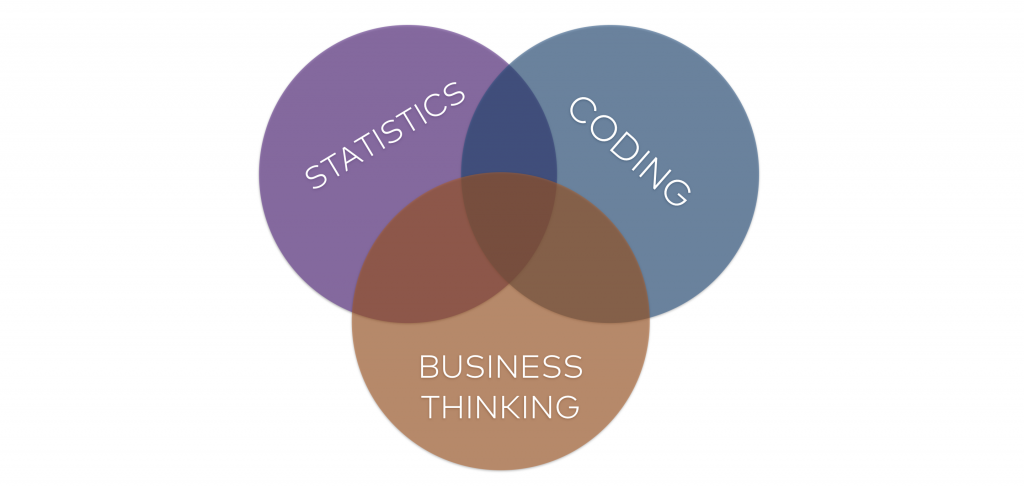
To be a fully featured data professional, you have to be good at all three!
I don’t think I have to explain why Statistics is important. Data is about numbers – and when you are working with numbers, you have to be confident with statistical and mathematical concepts.
Coding skills are required because the data you will work with is often hard-to-access, broken, messy, has missing values and so on. Fix these things in an Excel spreadsheet… well, not so easy. Coding will give you full flexibility, so it’s a must-have skill if you are seriously thinking about getting familiar with the basics of data analytics.
Domain knowledge and business thinking is a soft factor, but just as essential as statistics and coding. If you don’t have the business sense, you won’t be able to evaluate whether your data project makes a difference or not!
Data Coding – What languages to learn?
Note: it’s possible that as a data analyst you are not coding at all, but using smart tools like Google Analytics, Heatmapping tools, and A/B testing tools instead. Still, I strongly recommend that you learn to code. In this article I’ve summarized the pros and cons: Data Coding vs. Smart Tools.
If you start to learn coding for basic data analytics, I suggest beginning with any of these four languages:
- SQL
- Python
- Bash
- R
In fact this is the particular order that I personally would recommend to everyone who’s new to this field. Why? Let’s take a look at the languages one by one:
SQL for data analytics basics
SQL is a super-simple query language. It’s well structured and easy to interpret. So it’s perfect for beginners. I think that learning the basics of SQL for Data Analysis could happen in net ~15-20 hours (that includes a fair amount of practicing too). If you are interested, here’s a free 6-article tutorial series: SQL for Data Analysis ep#1.
Syntax example for SQL:SELECT * FROM my_datatable WHERE something = 'my_value';
Python for data science
Python is easy to interpret and easy to learn as well, but much more complex than SQL. Of course, that’s not the only difference between the two languages. I won’t go into details here, but let’s just say that Python is better for certain data tasks and SQL is better for others. When it comes to Python, it’s really good with scientific things, like predictive analytics and machine learning. It’s not an accident that it’s one of the most widely used languages by data scientists. Learning the basics of Python can take a bit more time (~100 hours for reaching a solid, but not yet advanced level.) If you want to get started, here’s my Python for Data Science series: Python for Data Science ep#1.
Syntax example for Python:new_variable = my_table[my_table.something == 'my_value']
Bash for data server operations
To be honest, if you build up solid SQL and Python knowledge, that will be already good enough to kick off your data career. But if you are really into this, I recommend learning bash, because that will be the language that you will use to move data files, give user permissions, automate scripts, and other cool things – on your data server. Here’s my Data Analytics in Bash article series: Learn Bash for Data Analysis ep #1
Syntax example for Bash:cat file.csv |grep 'my_value' > new_file.csv
R for data science
R is really similar to Python – just a little bit more challenging to learn. It’s originally developed by Statisticians for Statisticians, and as a consequence you can feel the twisted (but pragmatic) logic. R’s learning curve is steeper, but once you have learned it, you will see that it’s the most advanced language for complex statistical tasks.
Note: to be honest I barely use R, because Python serves all of my needs in my data projects.
Syntax example for R:new_variable <- subset(my_table, something == 'my_value')
Data Analytics Basics (for beginners): the “How to Become a Data Scientist” Video Course
Maybe you have more questions about the details… Like:
- What do you need to learn and why?
- What does your step-by-step data science learning plan look like?
- How much time will the learning process take?
- Where to learn? How can you practice? Should you really go to university?
- What’s the right mindset for a Data Analyst?
- How can you learn about business thinking?
- How will you get your first data analytics related job?
If you want to get answers to all these questions (and more), check my short (but sweet), free online video course: How to Become a Data Scientist!
Conclusion
I hope this brief summary gave you a good overview about the basics of data analytics. If you have questions or suggestions for expanding this article, drop me an email. And read about the 4 untold truths of learning data science here.
- If you want to learn more about how to become a data scientist, take my 50-minute video course: How to Become a Data Scientist. (It’s free!)
- Also check out my 6-week online course: The Junior Data Scientist’s First Month video course.
Cheers,
Tomi Mester
Cheers,
Tomi Mester