Connecting Looker Studio (previously: Google Data Studio) to your PostgreSQL database is easier than you would think. I will walk you through the whole process step by step. By the end of the article you will learn how to visualize your PostgreSQL data within a few minutes.
Before you start, it might be useful if you go through these articles first:
How to Become a Data Scientist
(free 50-minute video course by Tomi Mester)
Just subscribe to the Data36 Newsletter here (it’s free)!
Thank you!
You have successfully joined our subscriber list.
STEP 0
If you haven’t done it yet, register for Looker Studio. You can do it on lookerstudio.google.com (old link: datastudio.google.com). It’s free; all you need is a gmail email address.
STEP 1: Add a new Data Source!
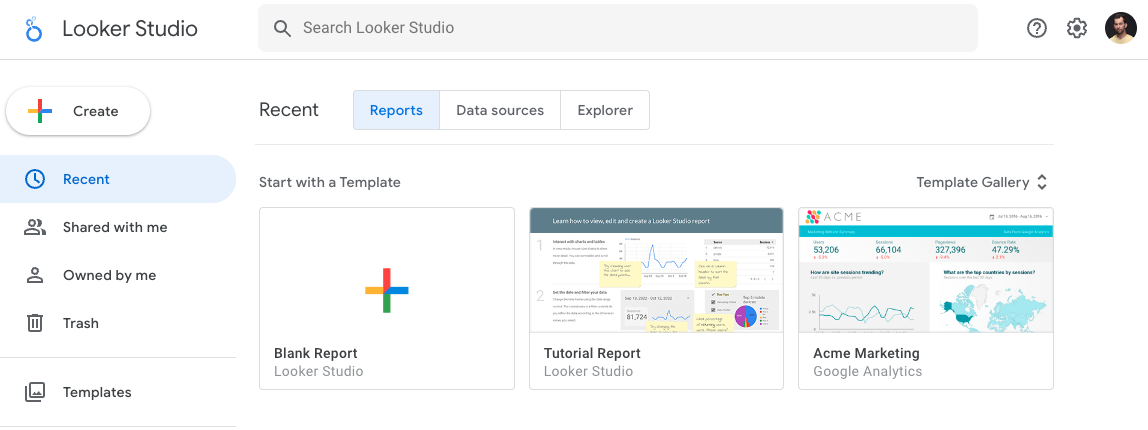
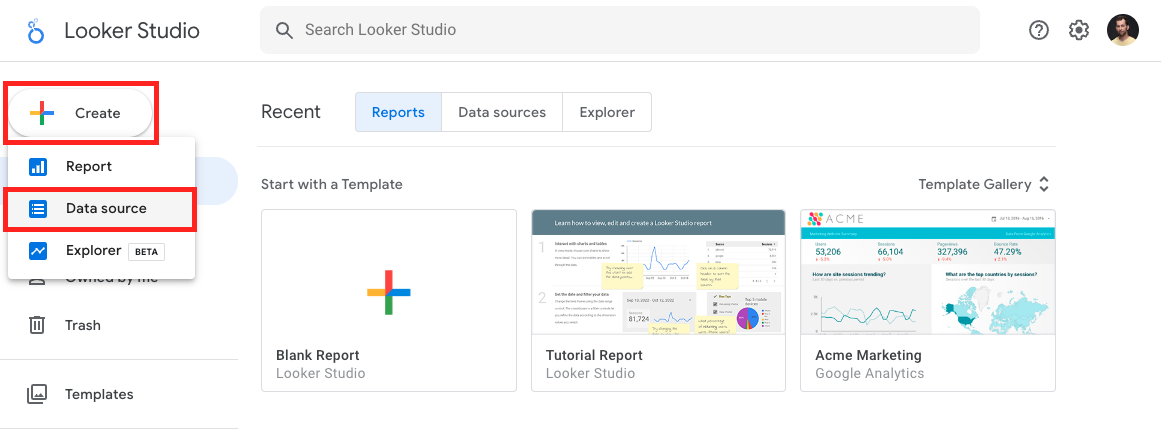
When you go to lookerstudio.google.com, you will see this landing page. Here, you can set up new reports and manage your existing ones. But what we want to do first is add a new Data Source. So click CREATE >> DATA SOURCE.
STEP 2: Select your connector!
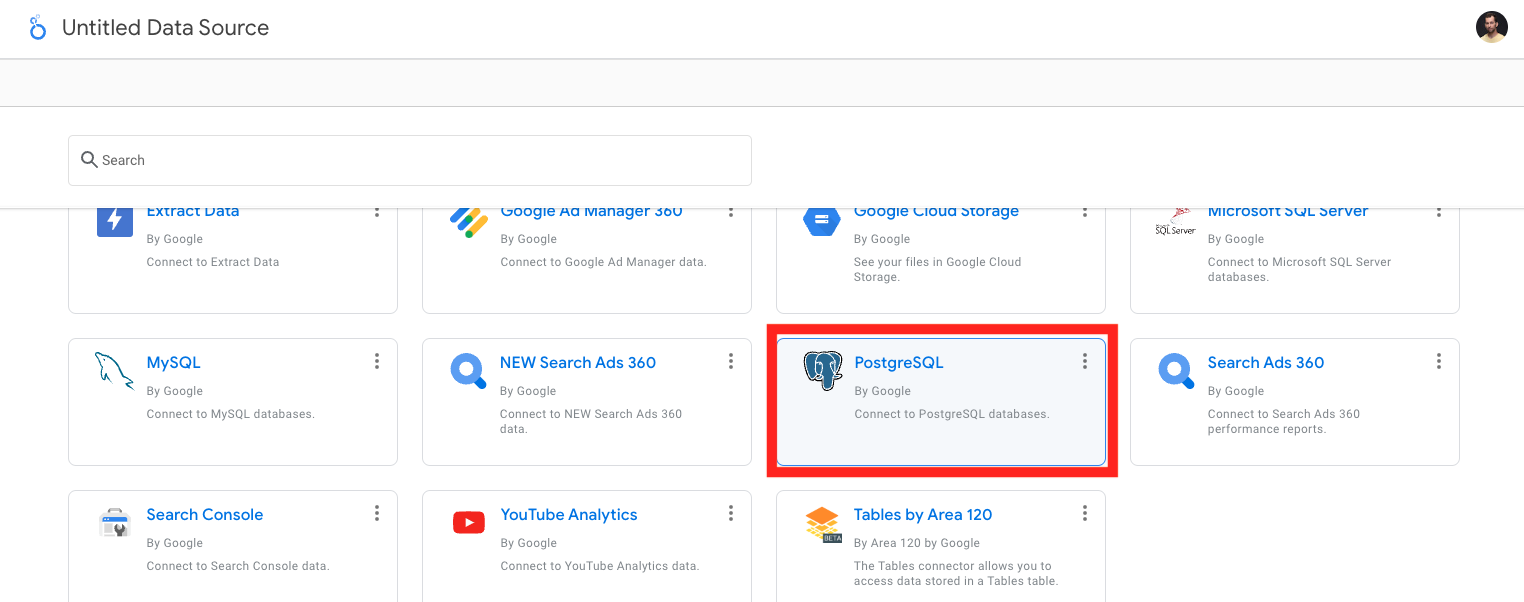
On this new window, you see many many connectors. You can connect to your Google Analytics data, your Google Adwords data, your Youtube data, etc. If you are looking for even more connectors, just scroll down and you will get dozens more.
We want to connect Looker Studio to PostgreSQL, so scroll down and click PostgreSQL:
STEP 3: Provide your data server login credentials!
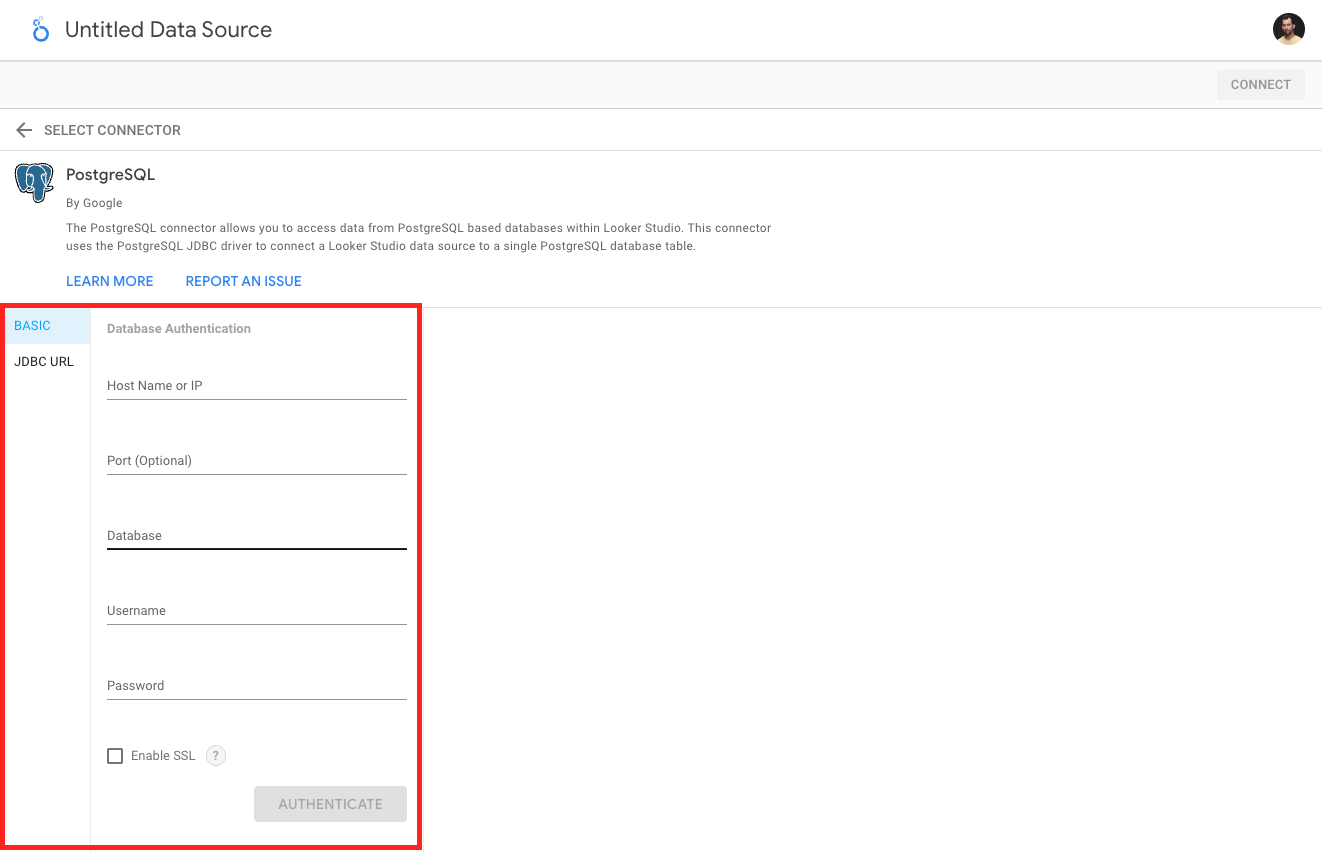
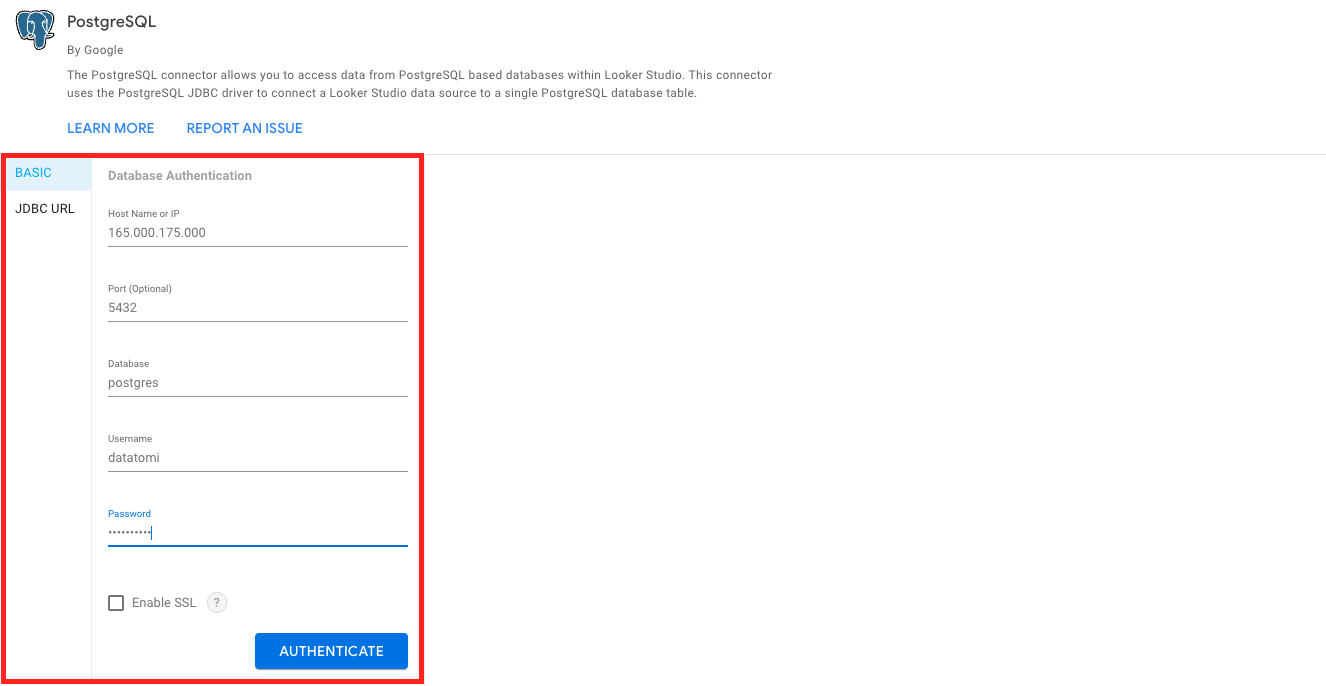
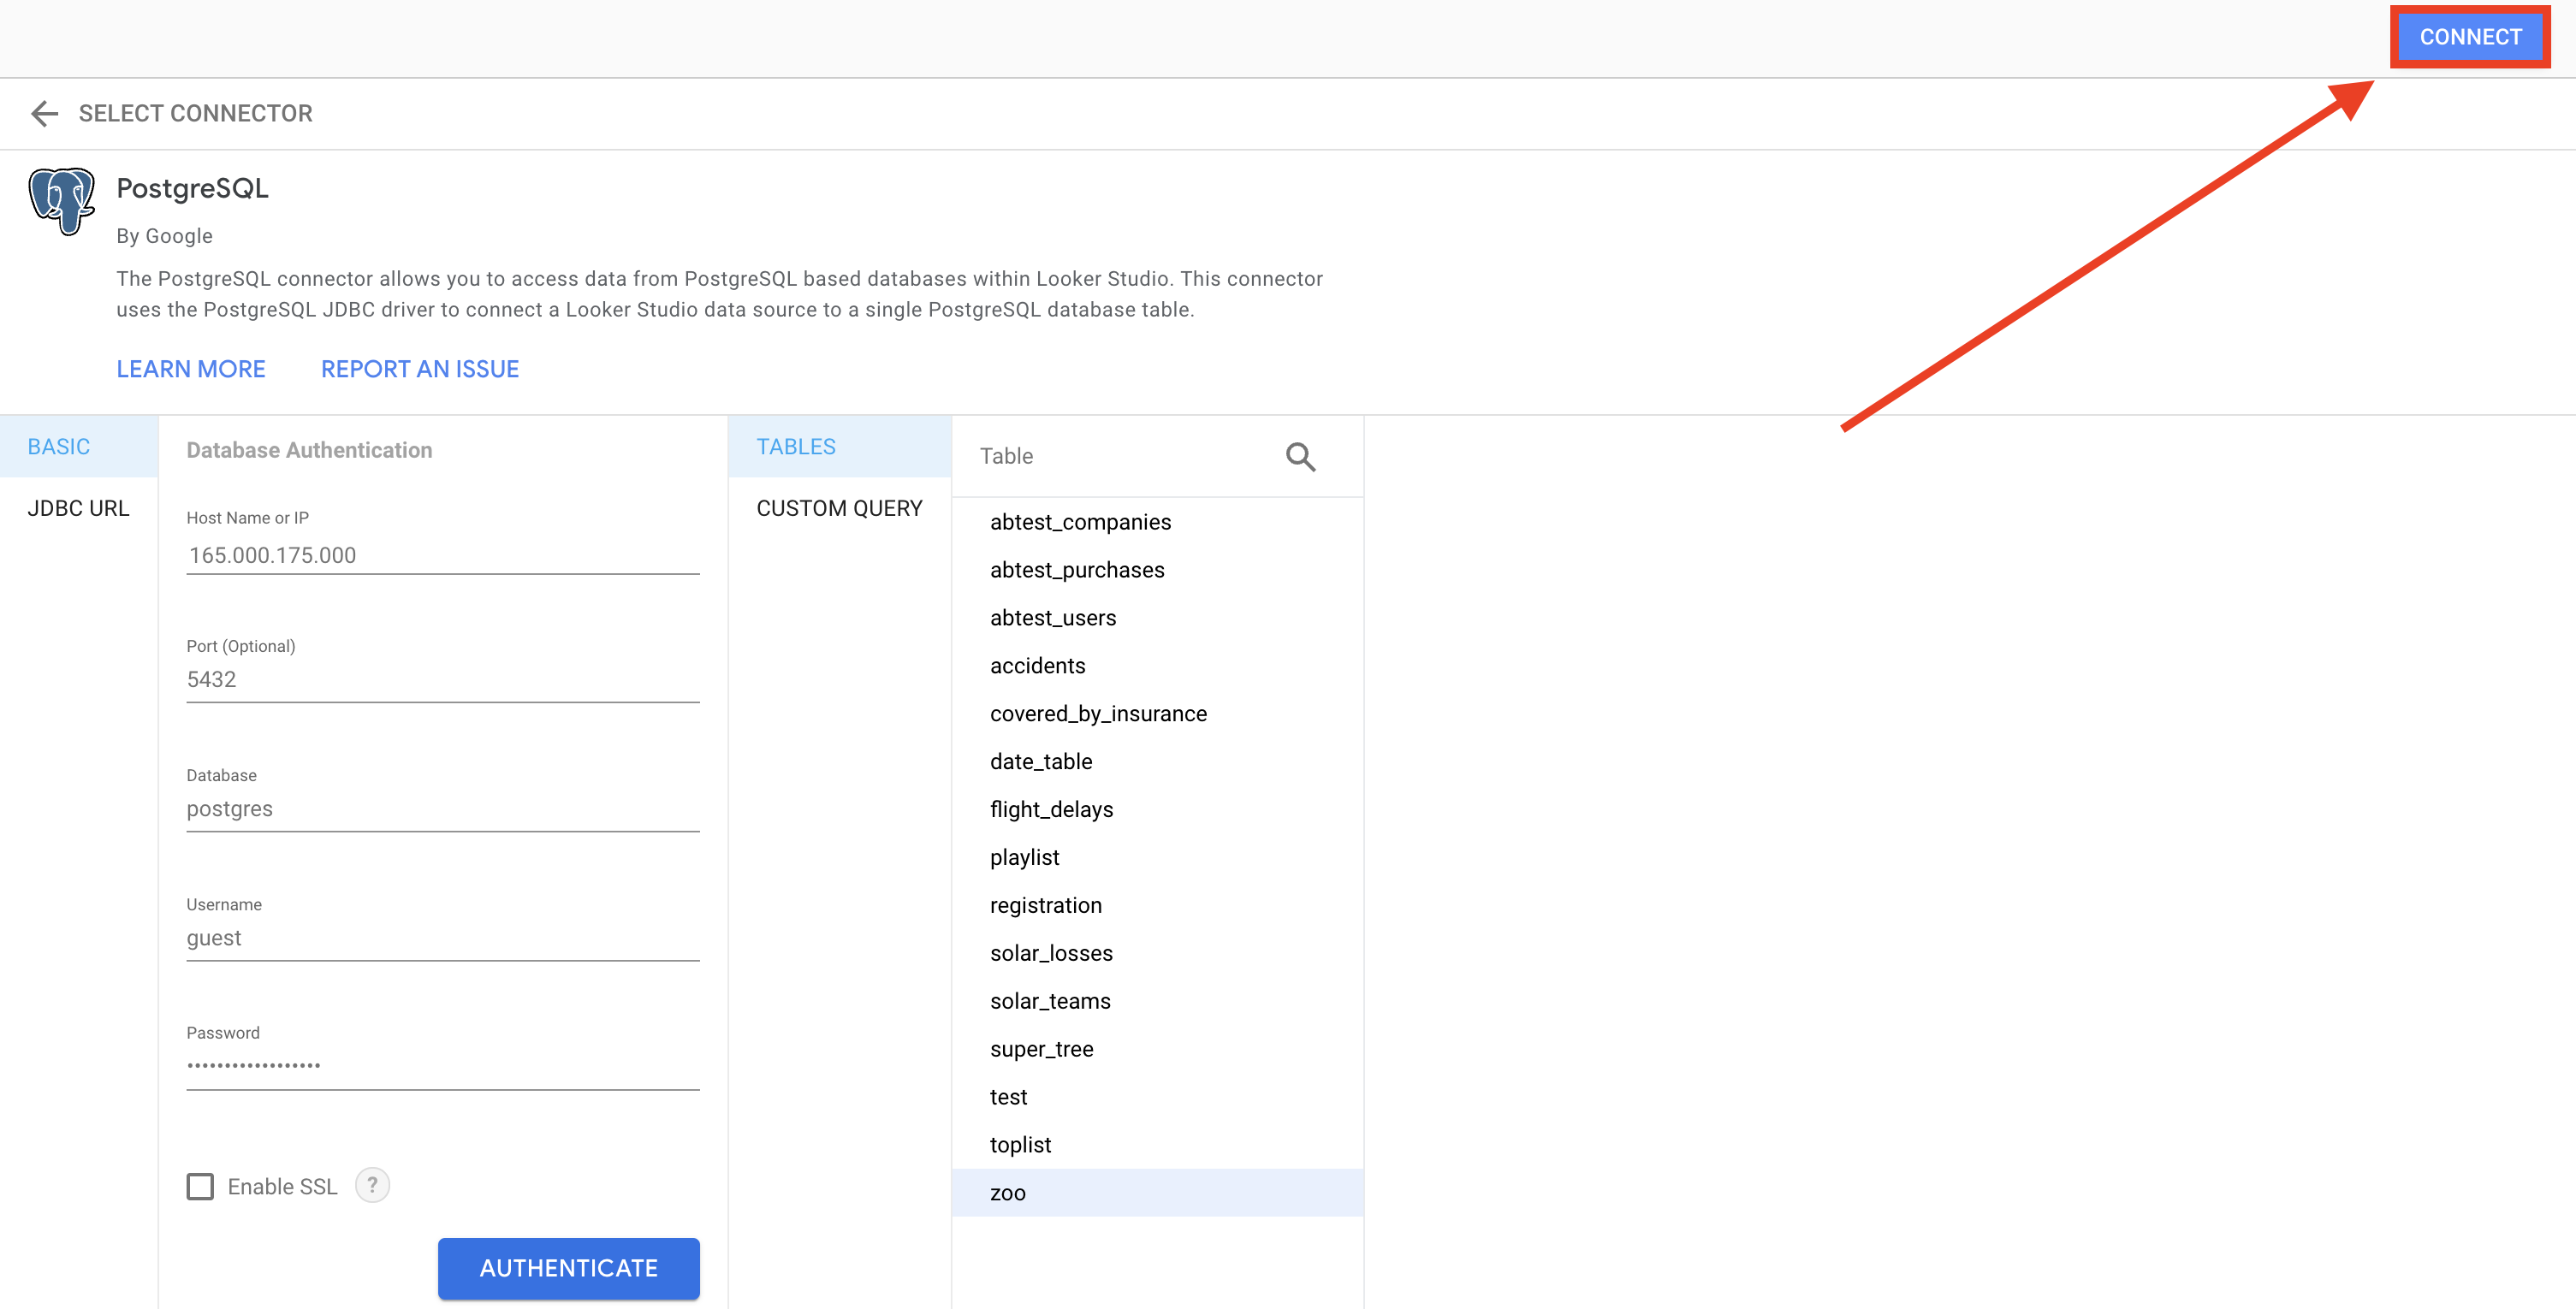
A “Database Authentication” window pops up. (Sometimes, before that, you also need to authorise your Google Drive account. It’s a one-click thing.) Don’t get intimidated; you just have to type the very same credentials that you use with SQL Workbench or pgadmin4.
It’s:
- Host Name or IP: the IP address of your data server. (The same that you use when you ssh to your data server from your terminal window, or when you establish a connection with SQL Workbench, or when you login to Jupyter Notebook or RStudio.)
Note: if you have no idea what am I talking about, go through the Install Python, R, SQL and bash article first! - Port: the port for PostgreSQL on your dataserver. By default, it’s: 5432. (If you didn’t change the configuration, this will be yours as well.)
- Database: the name of your database. By default, this is: postgres. (If you didn’t change the configuration, this will be yours as well.)
- Username: your SQL user’s username.
- Password: the password for your SQL user.
- Enable SSL connection: you can decide whether you want to use secure connection (tick it) or not (don’t tick it). For now, I’ll go without SSL connection. It’s just fine for practicing.
Okay, for me the filled-in form looks like this:
Now click AUTHENTICATE!
The Junior Data Scientist's First Month
A 100% practical online course. A 6-week simulation of being a junior data scientist at a true-to-life startup.
“Solving real problems, getting real experience – just like in a real data science job.”
STEP 4: Select a datatable!
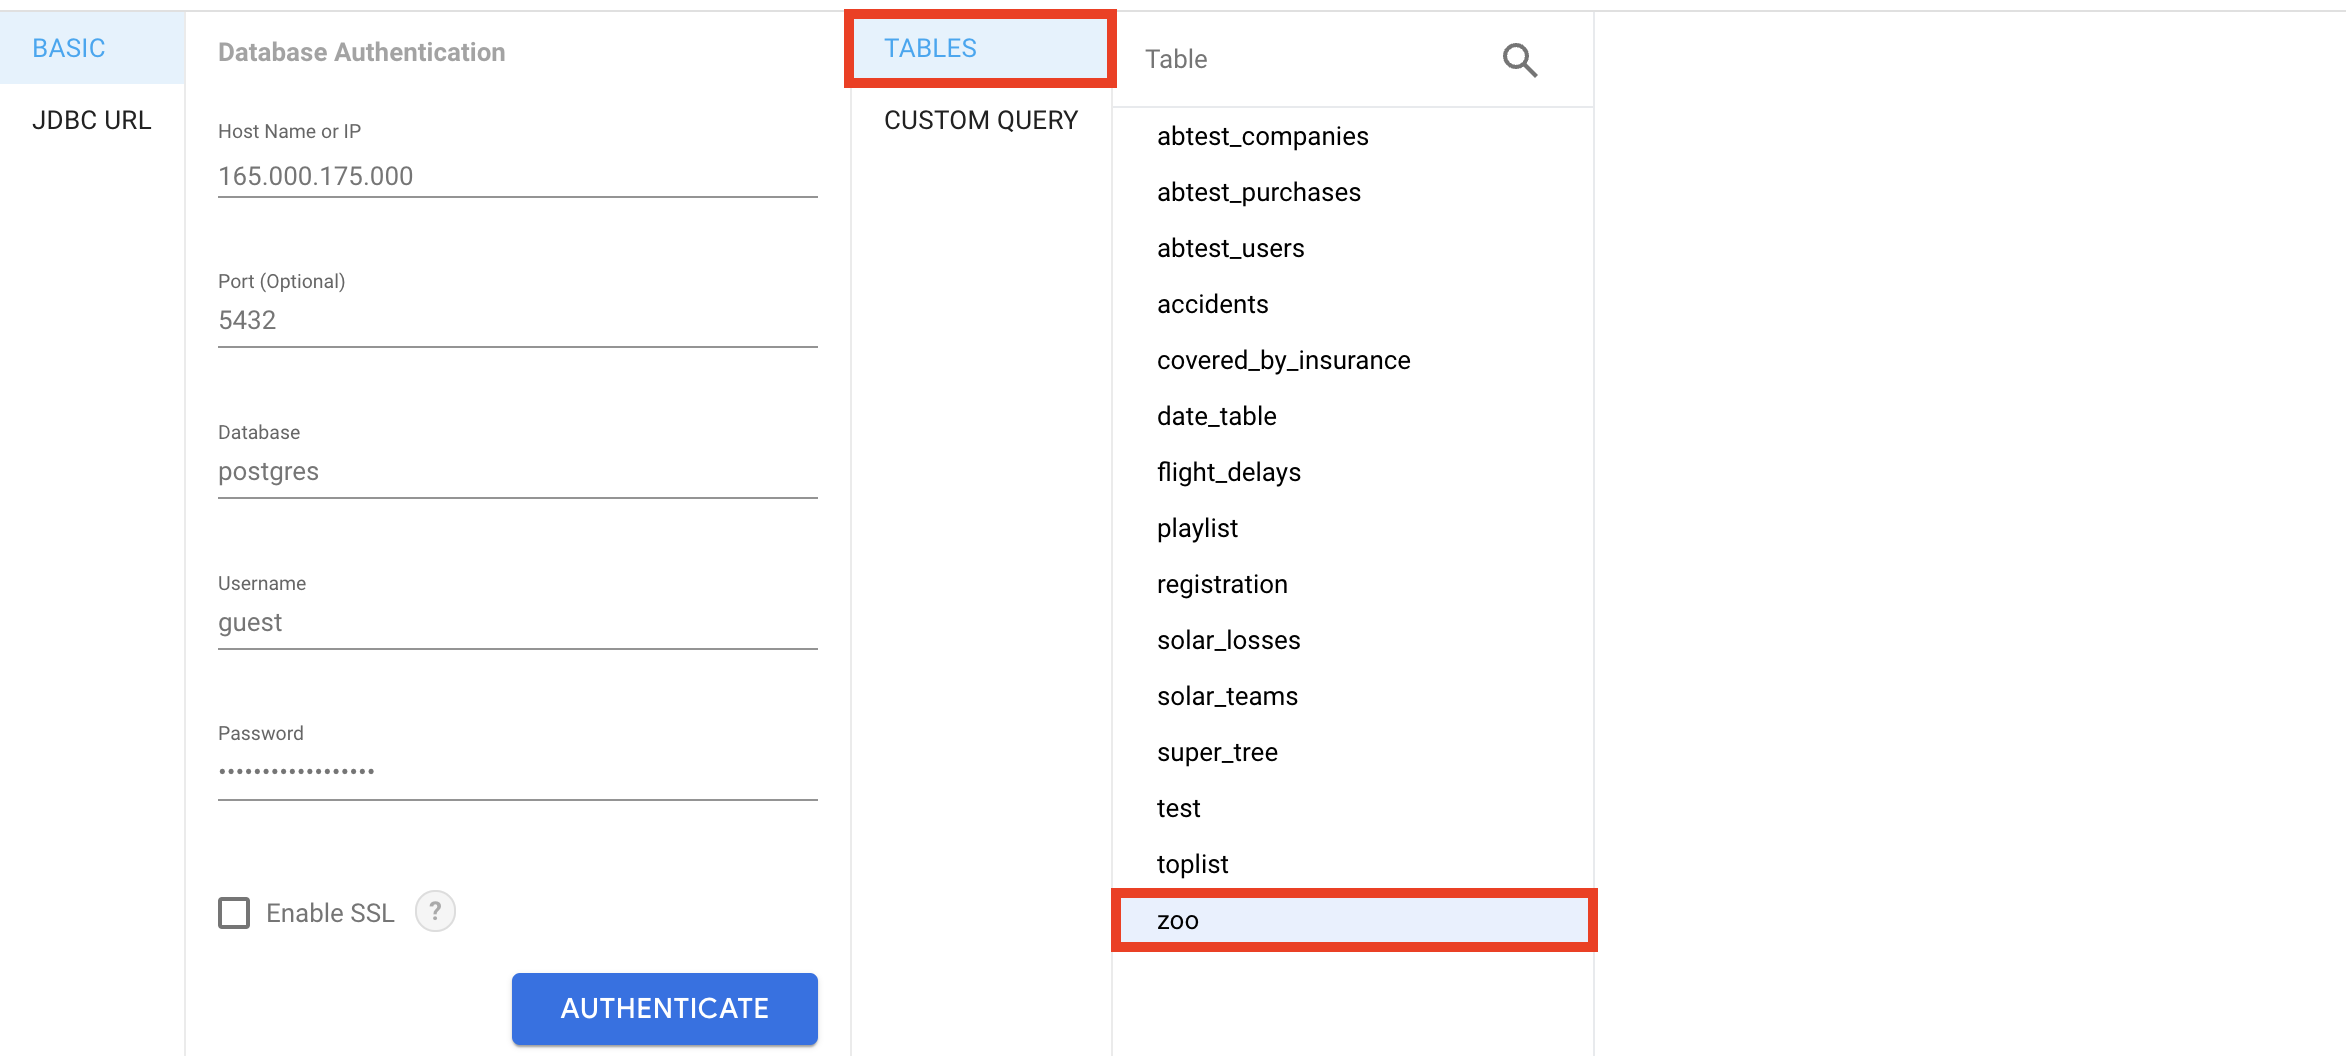
Next step: you have to select the data table you want to work with!
Just choose the one you want to import! I have only one table on my server: the zoo data set.
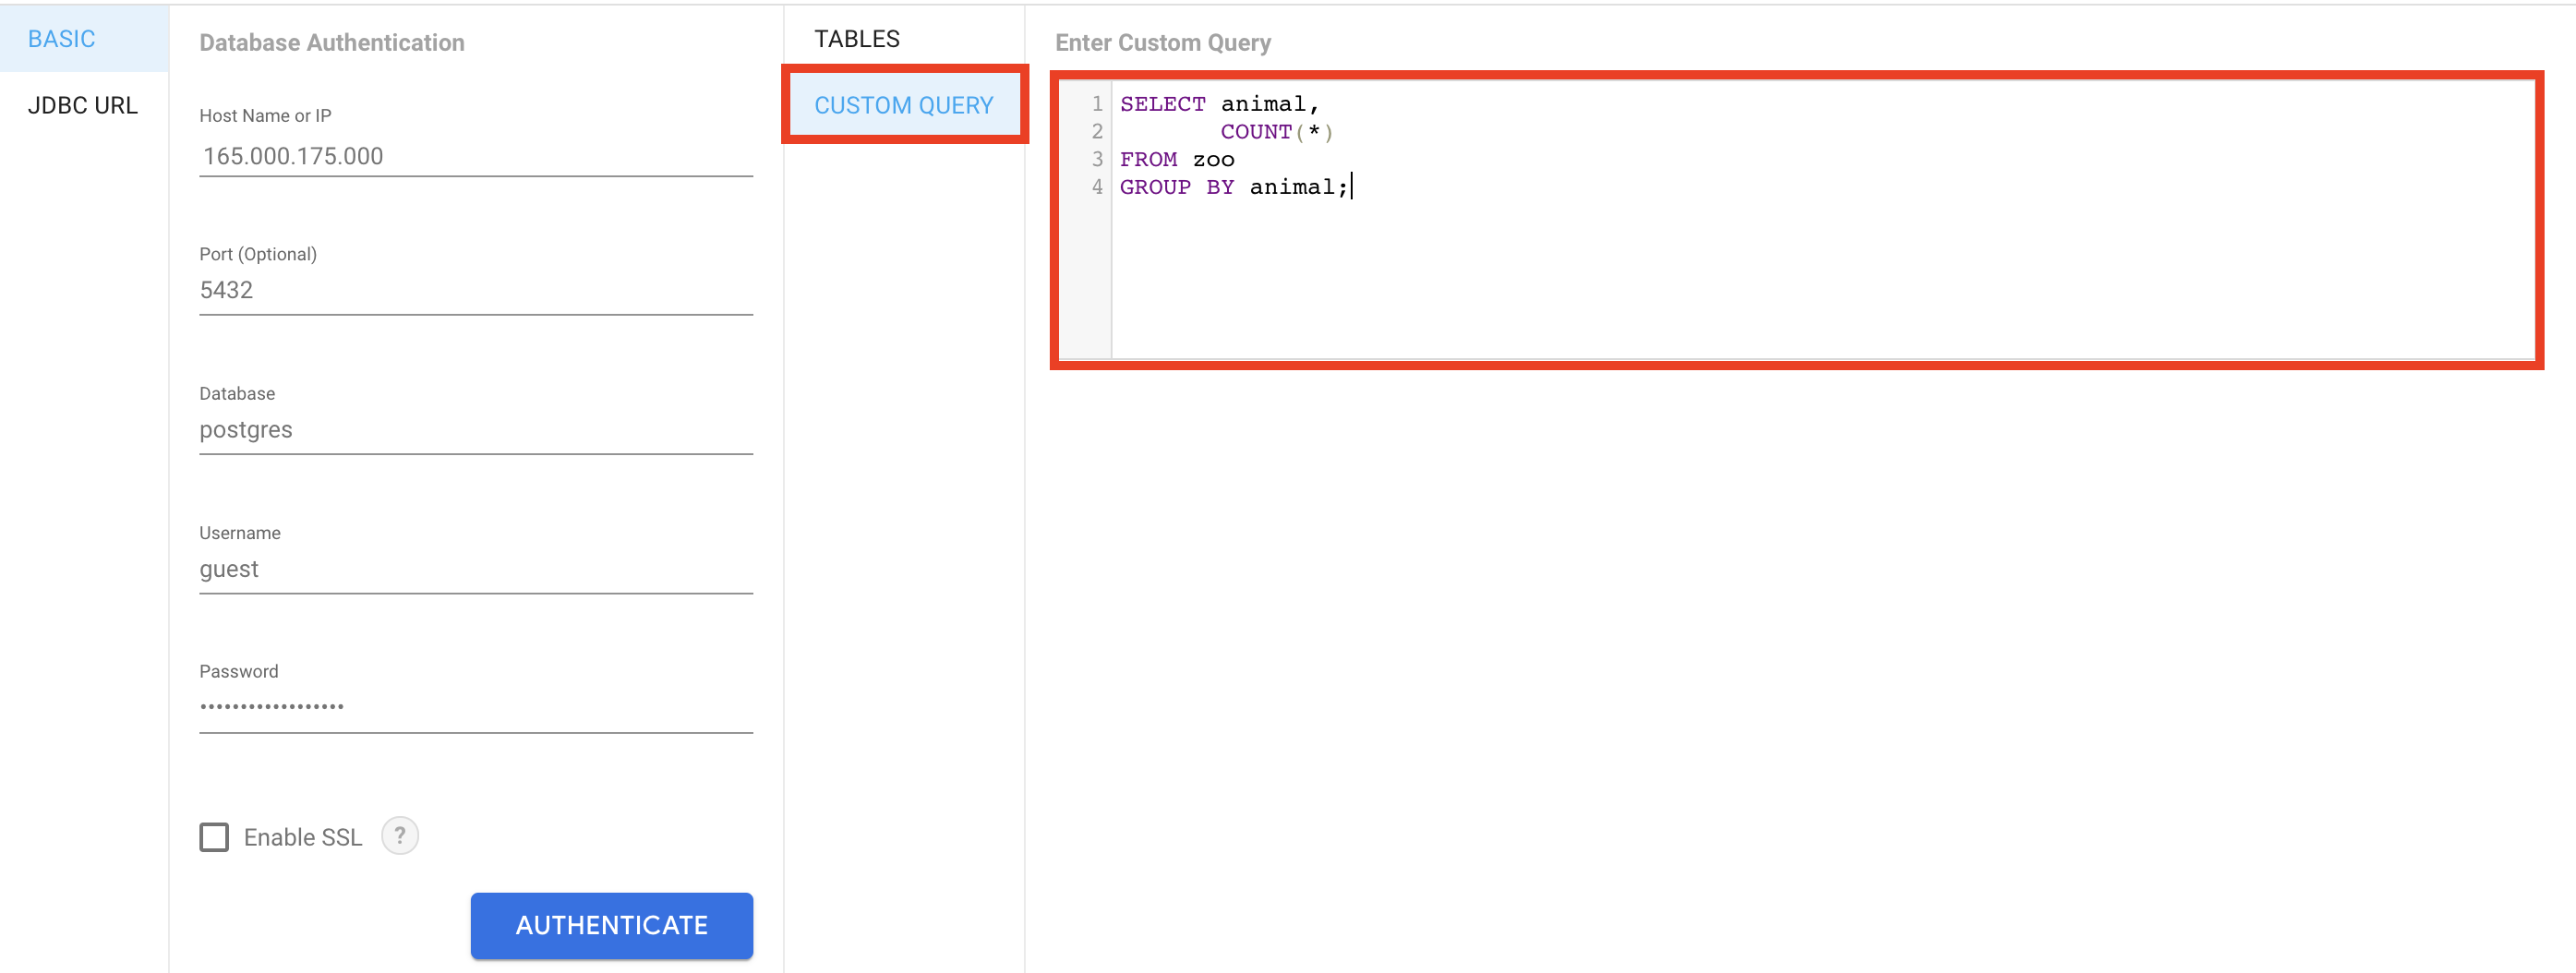
Note that there is another great feature in Looker Studio, called CUSTOM QUERY. Using CUSTOM QUERY, you can actually use a query to transform your PostgreSQL data to a preferred format before you connect it to Looker Studio. You can look at this feature as an extra layer between your PostgreSQL database and Looker Studio. It’s very handy if you don’t want to import your whole data table but only an aggregated version of it. (E.g. it can count the number of animals in my zoo dataset.)
Either way you go: click ‘CONNECT‘ in the top right corner!
STEP 5: Format your datatable!
As a last step of importing, you have to name your new datatable. Pick something simple and meaningful. You can also rename your columns and set the data type and the aggregate function as necessary.
Example #1: my zoo dataset.
Example #2: my zoo dataset with the animal-counter query
Note that every data import will create a new Looker Studio data source.
STEP 6: Create your reports.
And you are done!
From now on, the connection between Looker Studio and your PostgreSQL table will be there when you need it. It’s time to create some charts.
The last step is to click CREATE REPORT in the top right corner… And then creating reports.
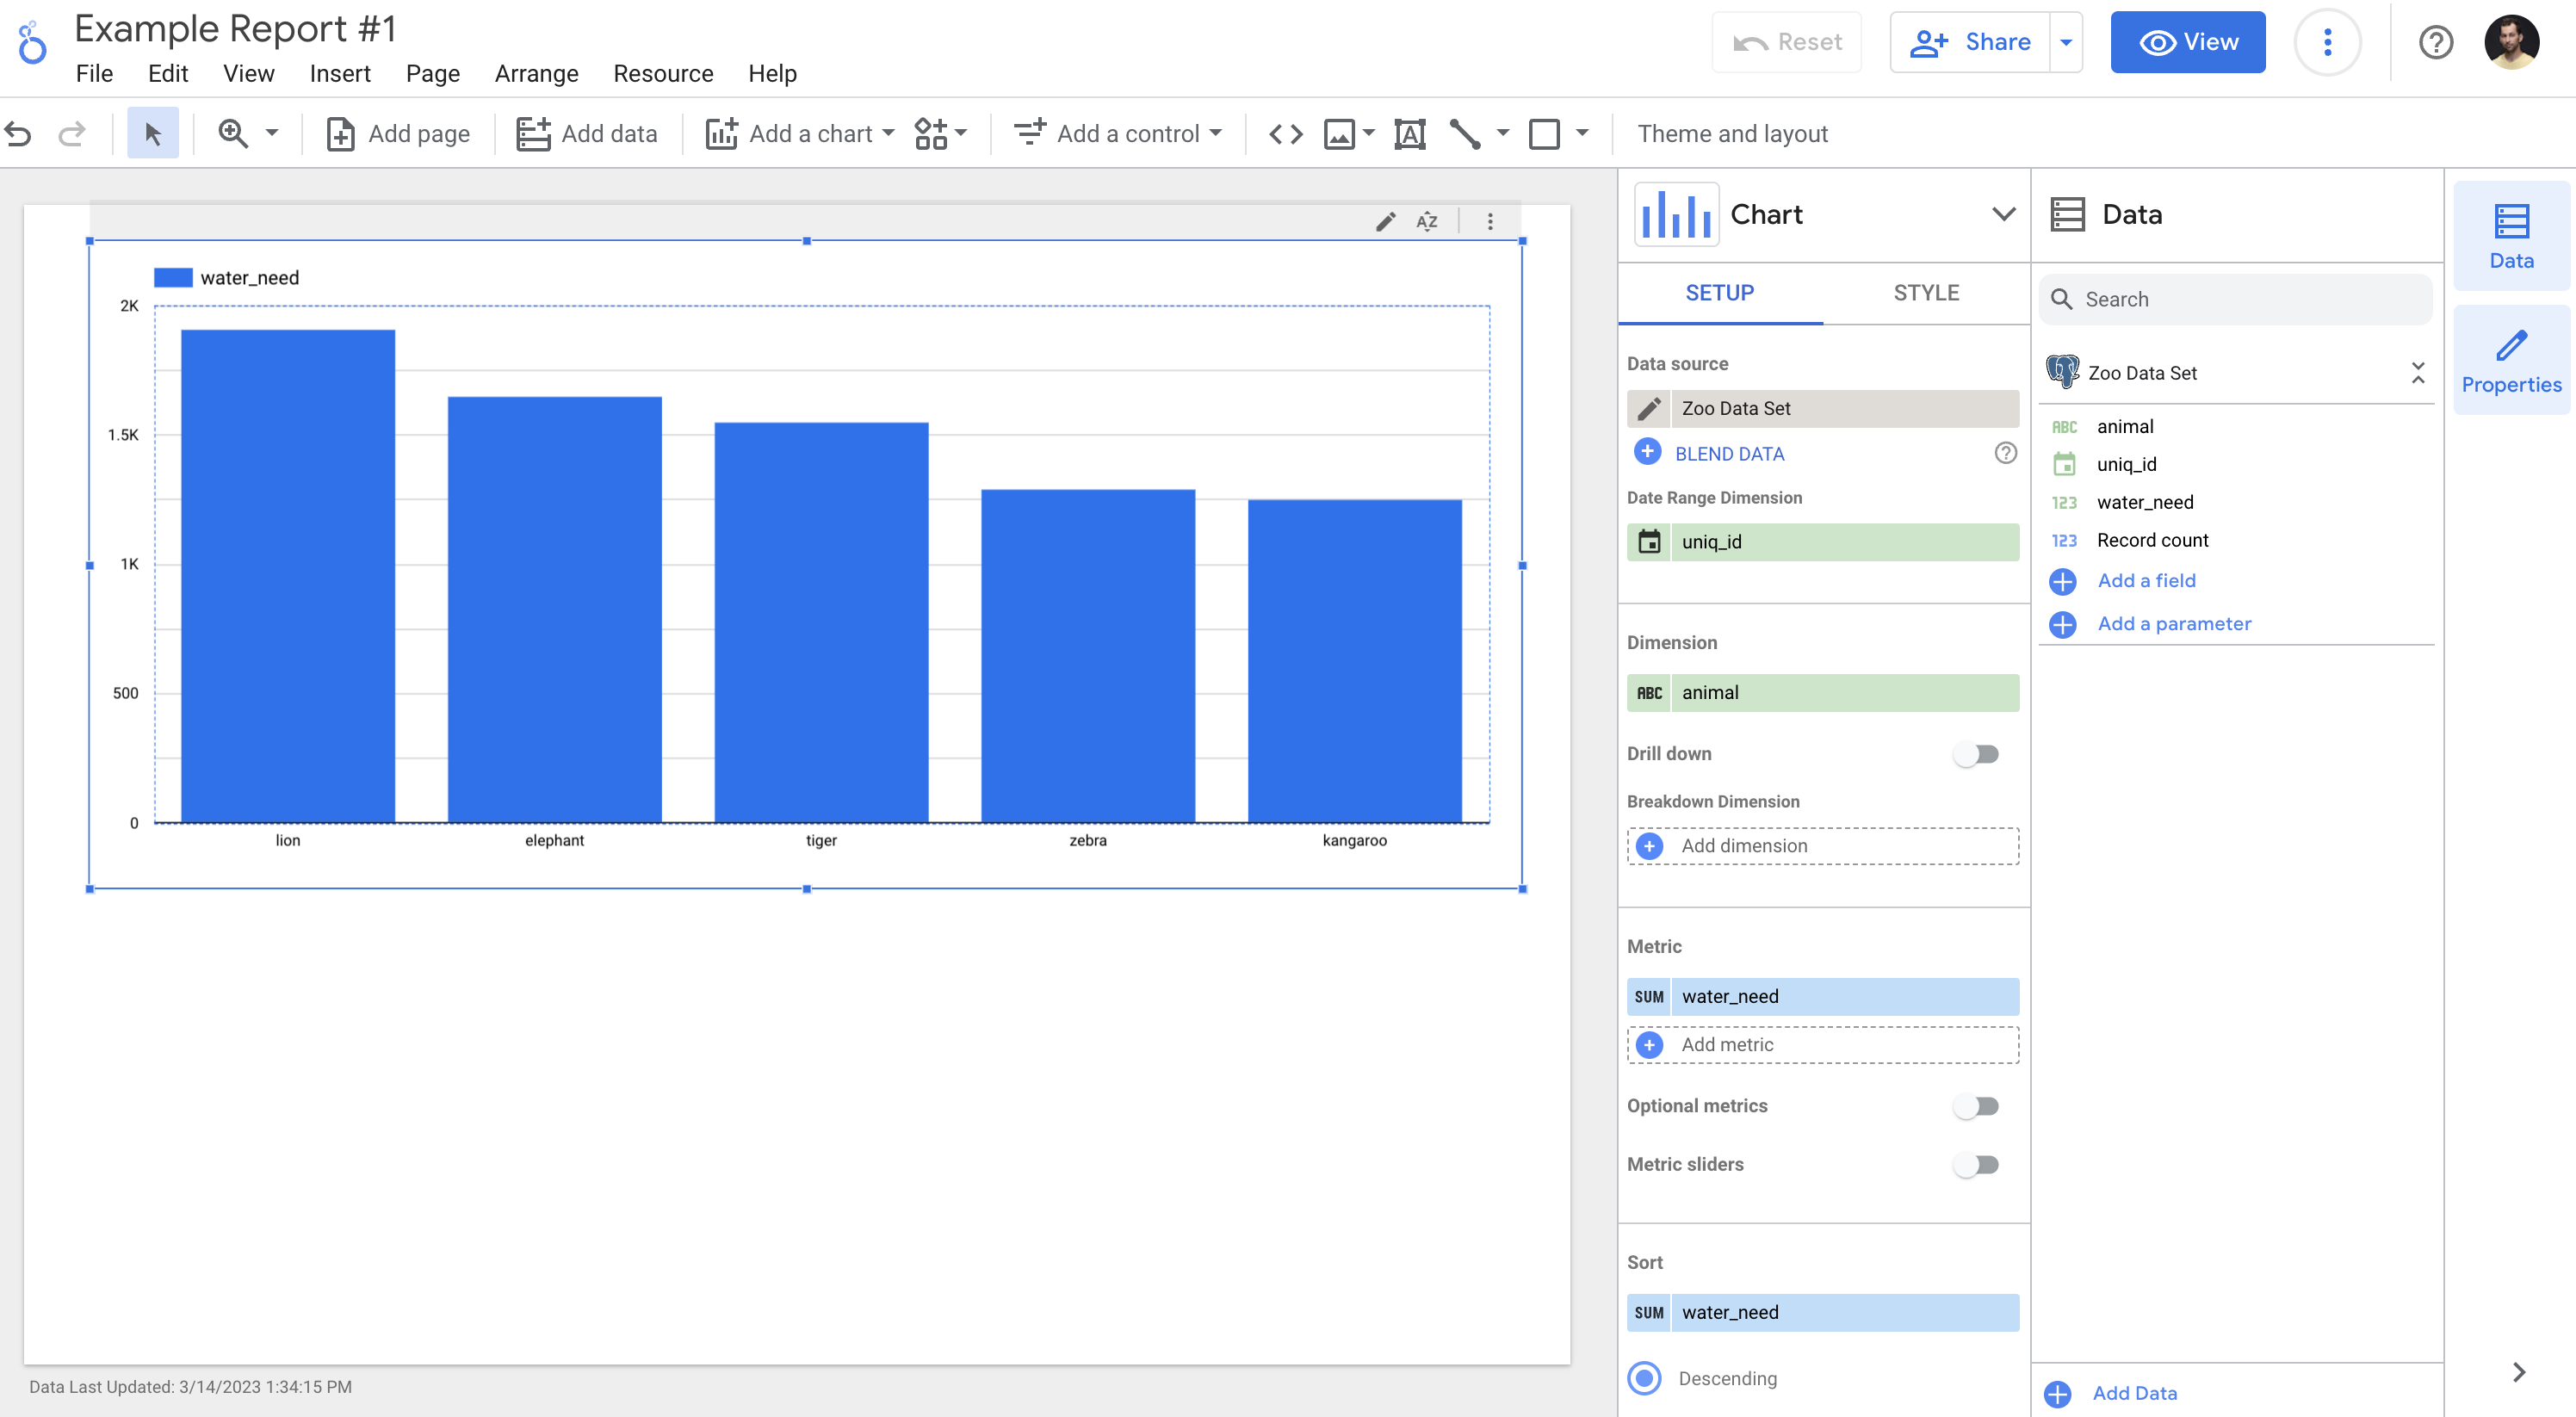
Example #1: a chart for my zoo data set showing the sum(water_need) values by animals.
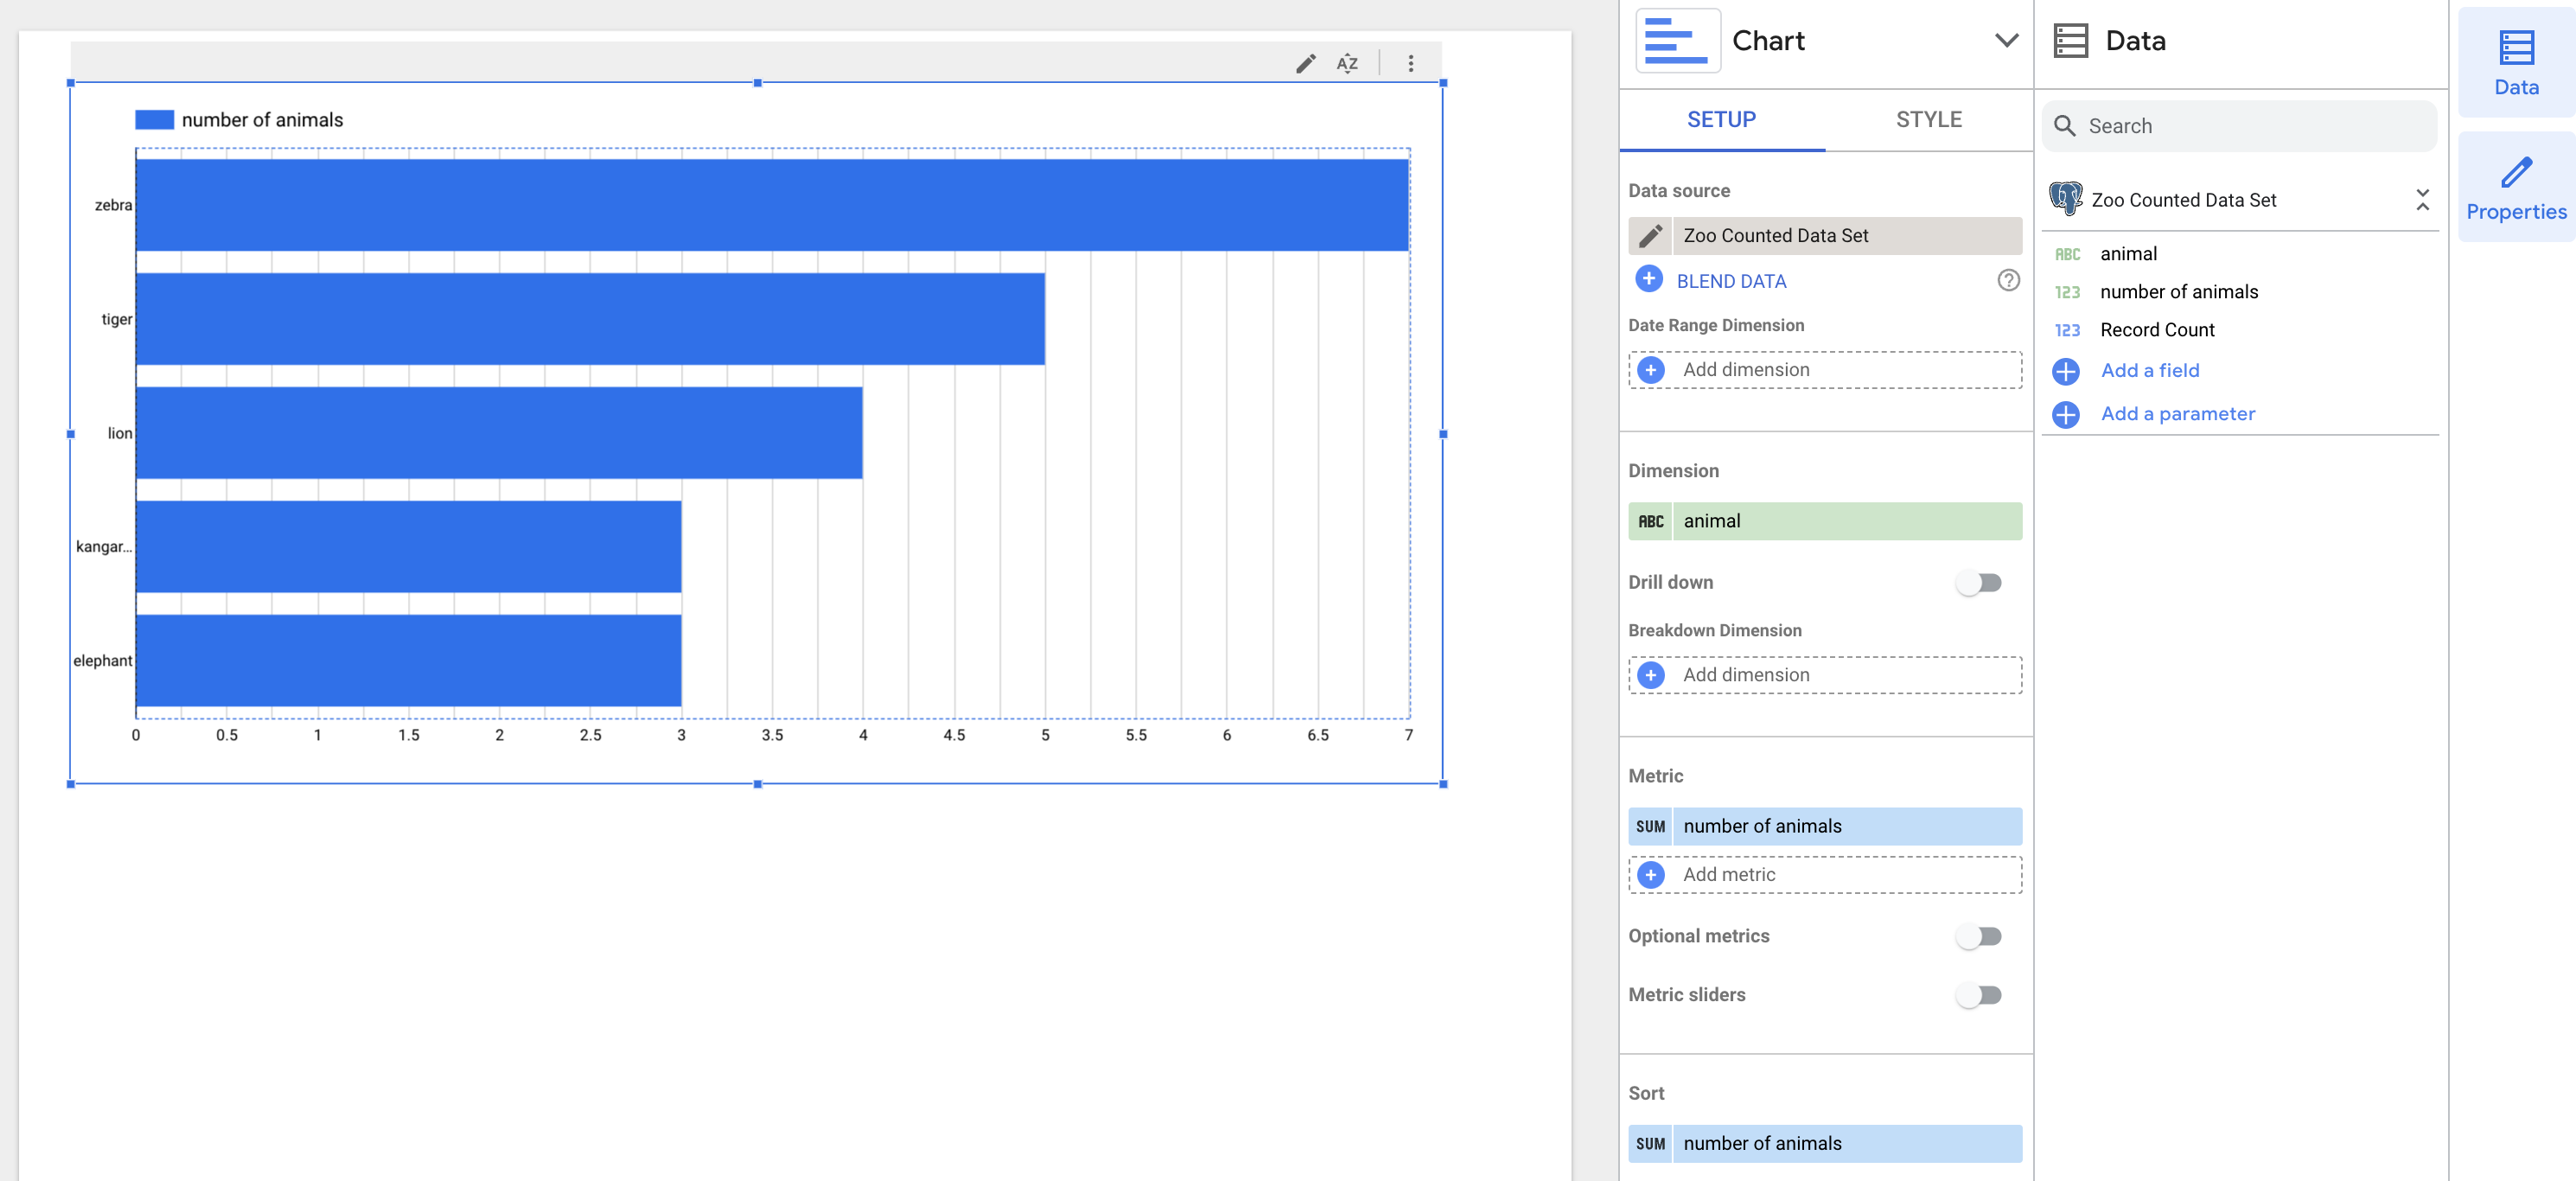
Example #2: a bar chart to show the number of animals for my zoo-data-counted data set.
If anything changes in your PostgreSQL table, it will come automatically to Looker Studio as well (so you don’t have to set up a new connection, just simply refresh your charts) which is awesome.
Conclusion
This is how to connect Looker Studio to PostgreSQL! Wasn’t that hard, was it?
Now, you are ready to visualize your SQL data in a simple and efficient way.
Note: You might wonder what’s the relation between Google Data Studio and Looker Studio. Well, practically it’s the same thing. Google acquired Looker in ~2022 and they rebranded their old product to Looker Studio, hence the different names. But really, it’s the same thing.
- If you want to learn more about how to become a data scientist, take my 50-minute video course: How to Become a Data Scientist. (It’s free!)
- Also check out my 6-week online course: The Junior Data Scientist’s First Month video course.
Cheers,
Tomi Mester
Cheers,
Tomi Mester

