
Creating heatmaps is a simple and efficient way to analyze your website visitors’ interactions and your users’ behavior on your website. If you are running an online business and working on a conversion rate optimization project, it’s indispensable to run website heatmaps, too – such as click, mouse movement or scroll heatmaps.
What is a website heatmap?
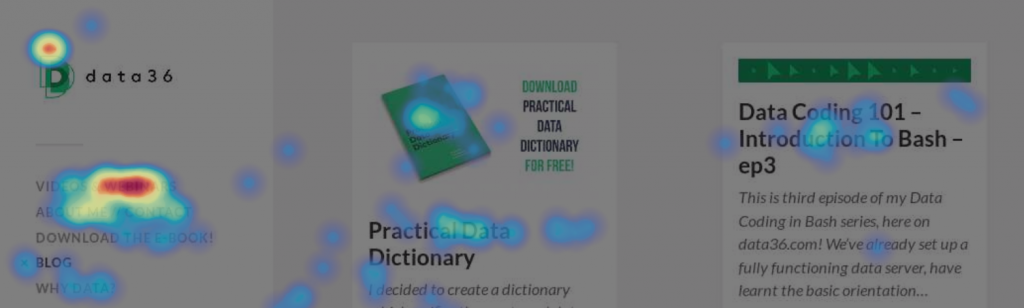
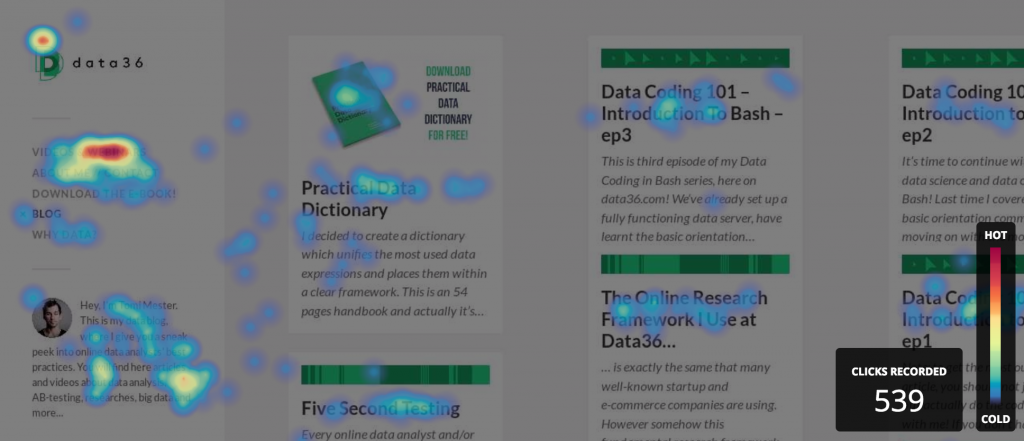
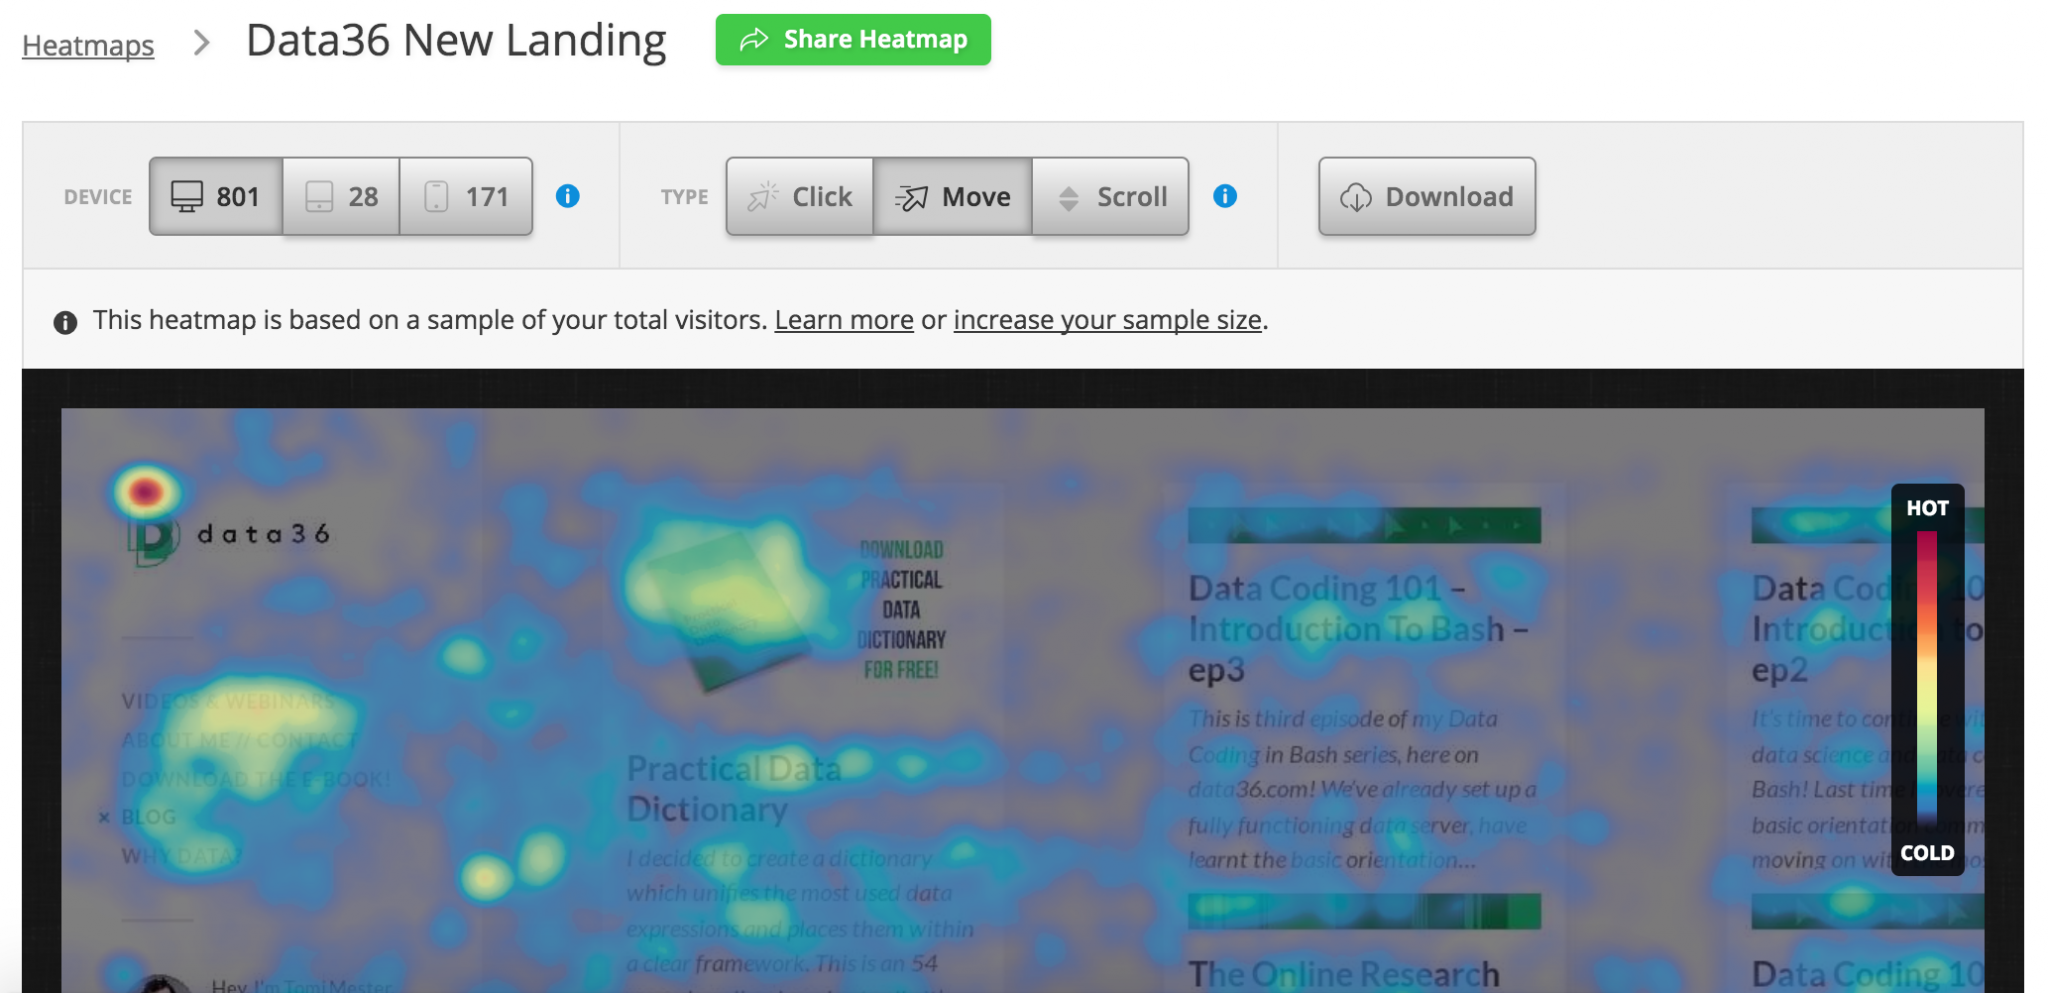
If the above picture didn’t make it clear: a website heatmap is created by recording all the clicks and mouse movements of your visitors – then coloring the different parts by frequency.
Red is the “hottest” (most frequented) and blue is the “coolest” (least frequented) part. This nice and easy-to-interpret visualisation format helps you to understand which part of your page drew the most visitor attention.
Heatmap tools and vendors
Good news! You don’t have to develop your own solution, as there are quite a few vendors on the market. I’ve tested almost all of them, so below I’ll share my recommendations (Note: I’m not affiliated with any of the vendors).
The (non-exhaustive) list:
- Hotjar
- Crazyegg
- Mouseflow
- Clicktale
- Google Analytics
- Lucky Orange
- Inspectlet
- Ptengine
- And other smaller players…
My personal favorite is Hotjar. I’ve tried it, I use it, I love it. It gives you many cool features for a very competitive price (most of the online businesses I’m working or have worked with are using either the $29 or the $89 monthly plan). Sometimes I use Crazyegg, too. It has fair pricing as well with the $49 or $99 monthly plans. The only real difference between Hotjar and Crazyegg are the features they provide:
| Hotjar | Crazyegg | |
| Basic Features | Click Heatmaps
Scroll Heatmaps |
Click Heatmaps
Scroll Heatmaps |
| Extra Features | Mouse Move Heatmaps
Session Recording |
Advanced segmentation |
| Other additional features | Exit-intent polls
Funnels Visitor polls etc… |
|
| Pricing (recommended plans) | $29 or $89 for small businesses | $49 or $99 for small businesses |
| Trustworthy data | Yes | Yes |
| User friendly | Yes | Yes |
As you see, Hotjar has more features. (Move heatmaps and session recordings are useful!) So my recommendation is to go with that in most cases – and only when you know that you’ll need advanced segmentation, go with Crazyegg.
I’m going to be super honest here:
I don’t really like the rest of the website heatmap vendors at all. I’ve tried Mouseflow, but I didn’t find it user friendly and the data they returned looked sometimes a bit off, so I just couldn’t trust it. When it comes to Clicktale, its pricing seems unreasonably high. And the built-in heatmap feature in Google Analytics, well… it’s not even a heatmap, so don’t use that either. (Just for the record: I love Google Analytics for the rest of the features it provides.)
Website Heatmap Types. Which one is for what?
Click heatmaps? Scroll heatmaps? Move heatmaps?
Which type is good for what?
Let’s break it down!
1. Click heatmaps:
This is the most straightforward heatmap type. Let’s say that you have a landing page with four CTA buttons. Of course you want to know which one brings the most conversions. A click heatmap can easily show you which one was clicked the most.
2. Move heatmaps:
Researchers have already proved that there is an ~80-90% correlation between eye- and mouse movements. I’m not suggesting here that eye-tracking is not important research to do. But for small online businesses, running a few move heatmaps on 2,000 visitors for $29 might be better value for money than running an eye tracking analysis on 5 users for $500-$5000. Especially if they yield roughly the same results.
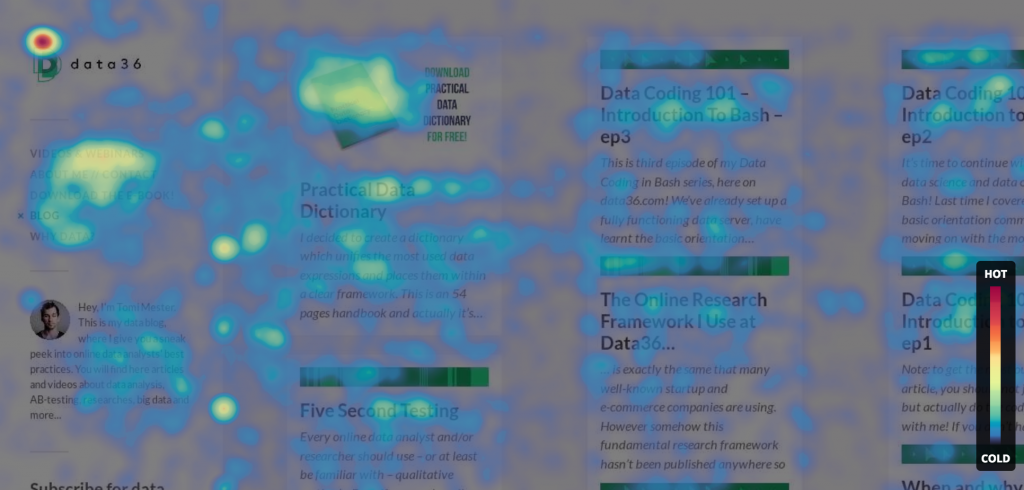
When exactly should you use it? Eg. on e-commerce product pages, where people spend big time with reading descriptions and watching product pictures, but they do not necessarily click. Based on where they move their cursor we can conclude what part of the page they were watching and get a good estimation of which part of the text they have read and which part they haven’t.
3. Scroll heatmaps:
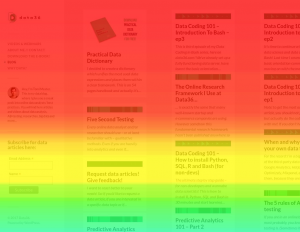
You would be surprised if you knew how many of your visitors are not scrolling after landing on your website. I have analysed over 1,000 different webpages in the last few years and have barely seen one where more than 70% of people have scrolled below the fold. Who knows, maybe that’s not the case on your website – but it’s really easy to find out by running a scroll heatmap.
Note: with scroll heatmaps I recommend taking a further look at the different segments of mobile, desktop and tablet users. (You can do that in Hotjar.) Because on mobile and tablet usually people are scrolling…
4. Session Recordings:
I know, kinda creepy, but this is what it is: javascript snippets are able to record visitors’ sessions, so you can analyze them, too. It’s a great tool to have in your kit because a website heatmap in itself is only an abstraction of the user journey. A video like this one represents the actual struggle of a visitor much better.
(Important note: password and credit card fields are automatically removed from the recordings in most heatmapping tools. Before you start a session recording, though, you should double-check this, to make sure you are not violating visitors’ rights.)
How to implement your website heatmap tool?
Super easy.
Very obviously, first you have to sign up for one of the vendors.
I’ll take Hotjar as an example.
When you register, you have to specify your domain, then implement a tracking code snippet into your website. All heatmapping tools use JavaScript. You can implement the code via Google Tag Manager (I prefer that) or you can simply copy-paste the given snippet into your website code directly.
Note: If you are using WordPress, you can even use the free Hotjar or/and Crazyegg plugins.
Running website heatmaps – as part of your analytics strategy
Here’s how I use website heatmaps when I run conversion rate optimization projects:
Before anything else, I like to run a few usability tests, where I can meet with the users and website visitors in real life and see their interactions with my own eyes – even more, I can ask questions from them. This helps me to point my attention to some key problems that I might never think about by myself, and to some key elements that I should focus on more during my research.
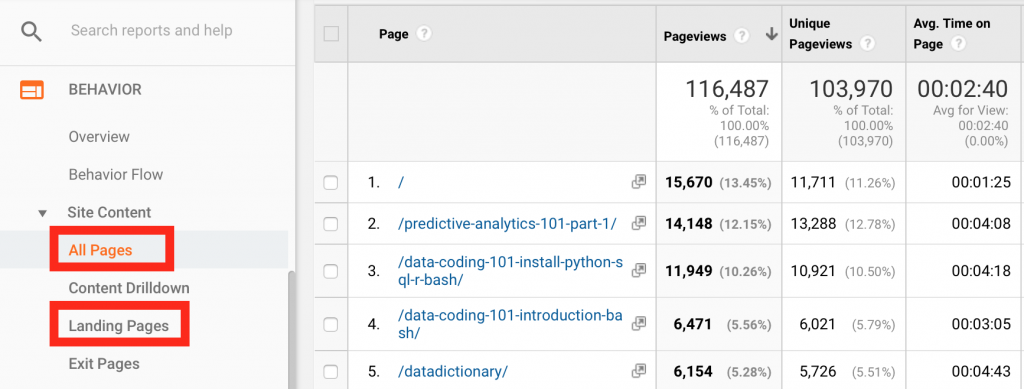
As a second step, I like to go to Google Analytics and check the BEHAVIOUR —» PAGES and the BEHAVIOUR —» LANDING PAGES reports. With these two I can find the pages with the highest traffic. Usually these are the pages that have a higher impact on my conversion results, too.
Once I’m done with usability testing and my initial Google Analytics research, I usually have a list of around 10-12 webpages I want to see a heatmap of.
At this point I also try to come up with hypotheses: e.g. “I expect that 10% of my visitors will click the XY CTA button” or “I expect that at least 50% of users will scroll below the fold.”
It’s important to understand that running website heatmaps is not a “l’art pour l’art” activity. Once you get enough data in a Hotjar heatmap project, for instance, you’ll want to integrate the results with all the other research you’ve been doing (eg. five second testing, funnel analysis, cohort analysis, etc…). Only looking at all these data together will lead you to a well-founded conclusion.
And when you have that conclusion, only then you can go ahead and implement your modifications. Well, actually, not even then: first I’d recommend that you A/B test your idea. But let’s get back to that in another article!
How to set up a website heatmap?
If you are done with the tracking code implementation and with the pre-study-phase, it’s time to set up your actual website heatmaps. Don’t worry, it’s really easy. In Hotjar, for example, you need to go through four simple steps:
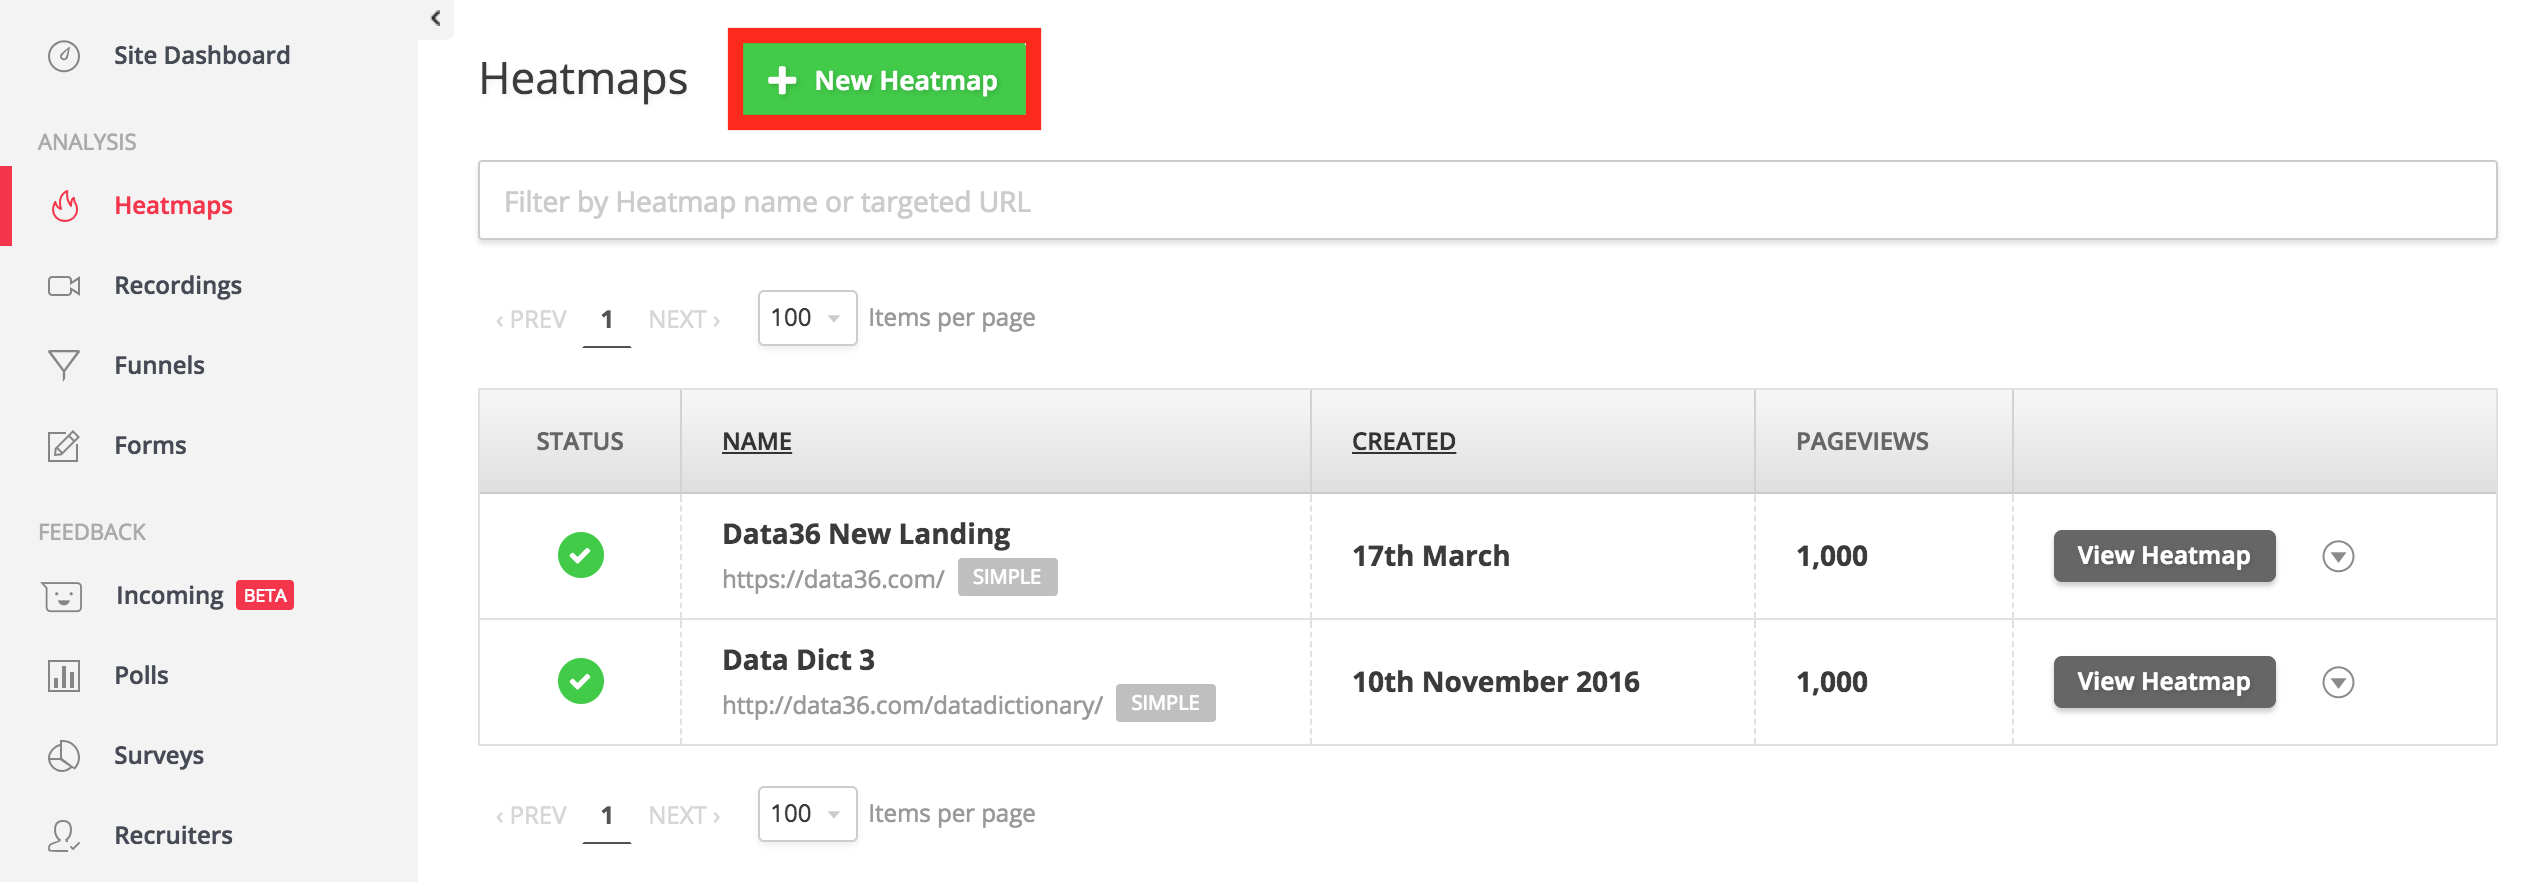
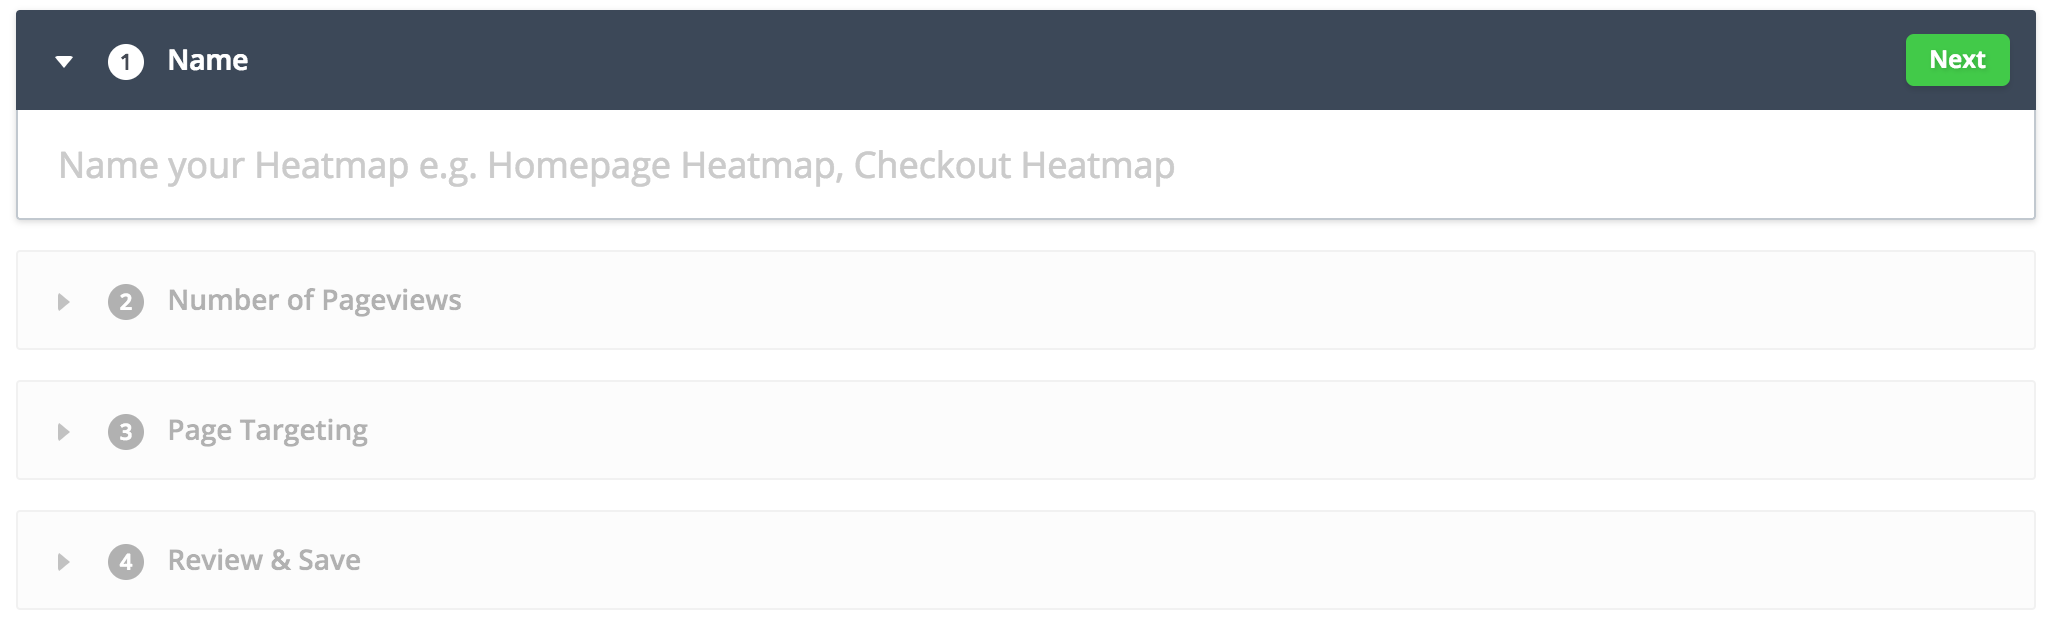
- When you click “+ New Heatmap”, you will have to name your Hotjar heatmap project.

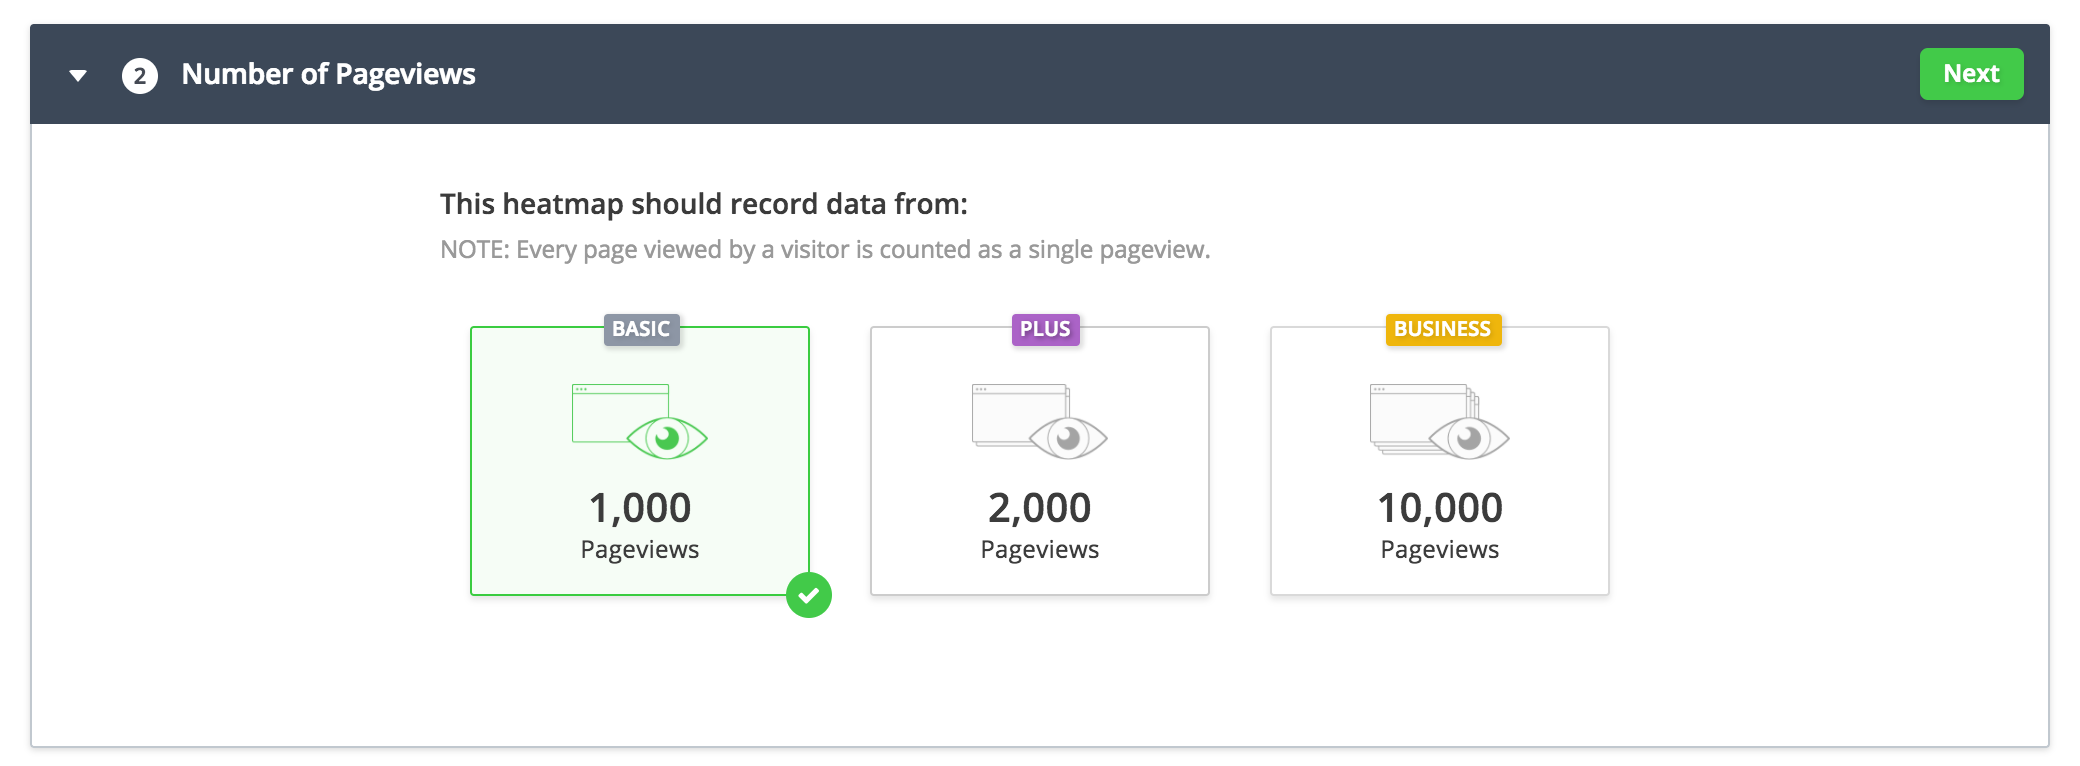
- Then you have to select the sample size: how many pageviews you would like to base your heatmap on. (I recommend 2,000 pageviews.)

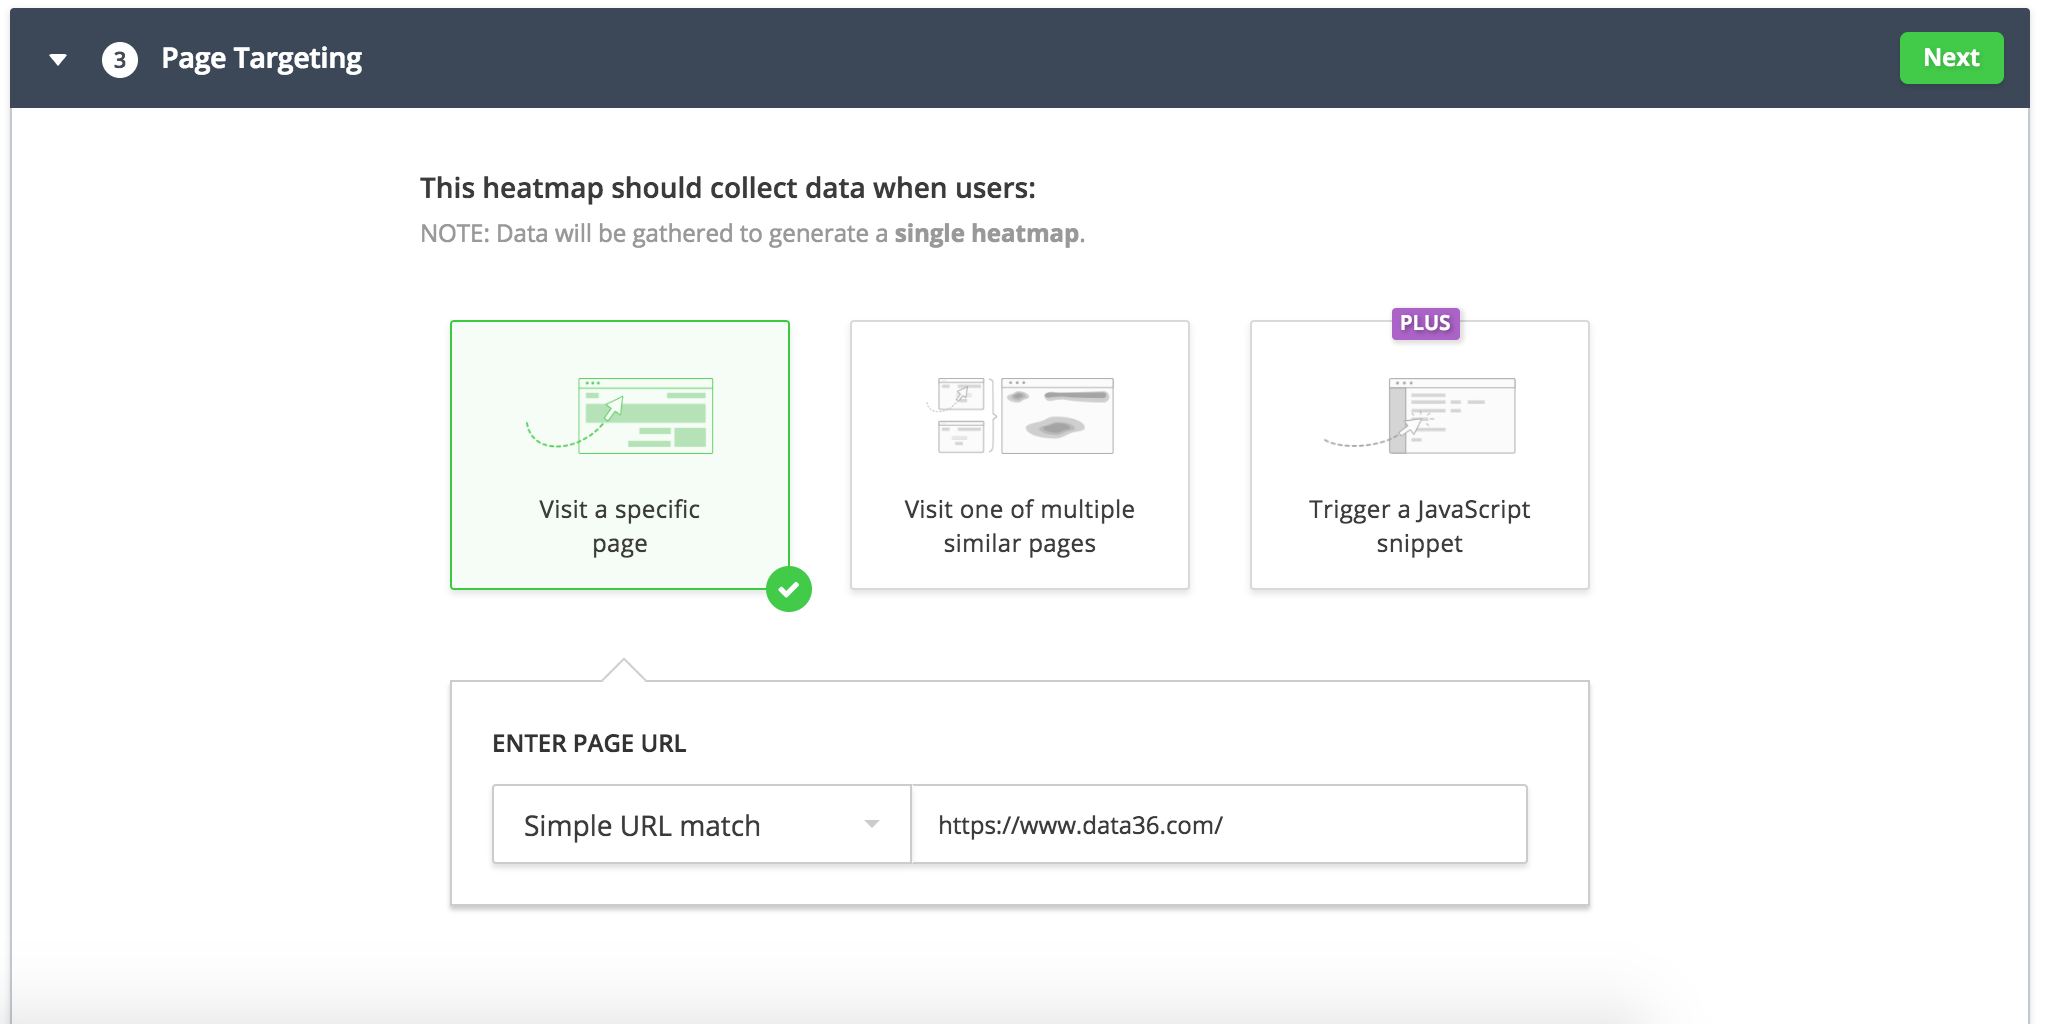
- The next step is to specify the URL. It can be a simple match (eg. www.data36.com/website-heatmap-tools-features-best-practices), but if you are a more advanced player, you can use regular expressions too (e.g. to monitor multiple product pages in an e-commerce store).

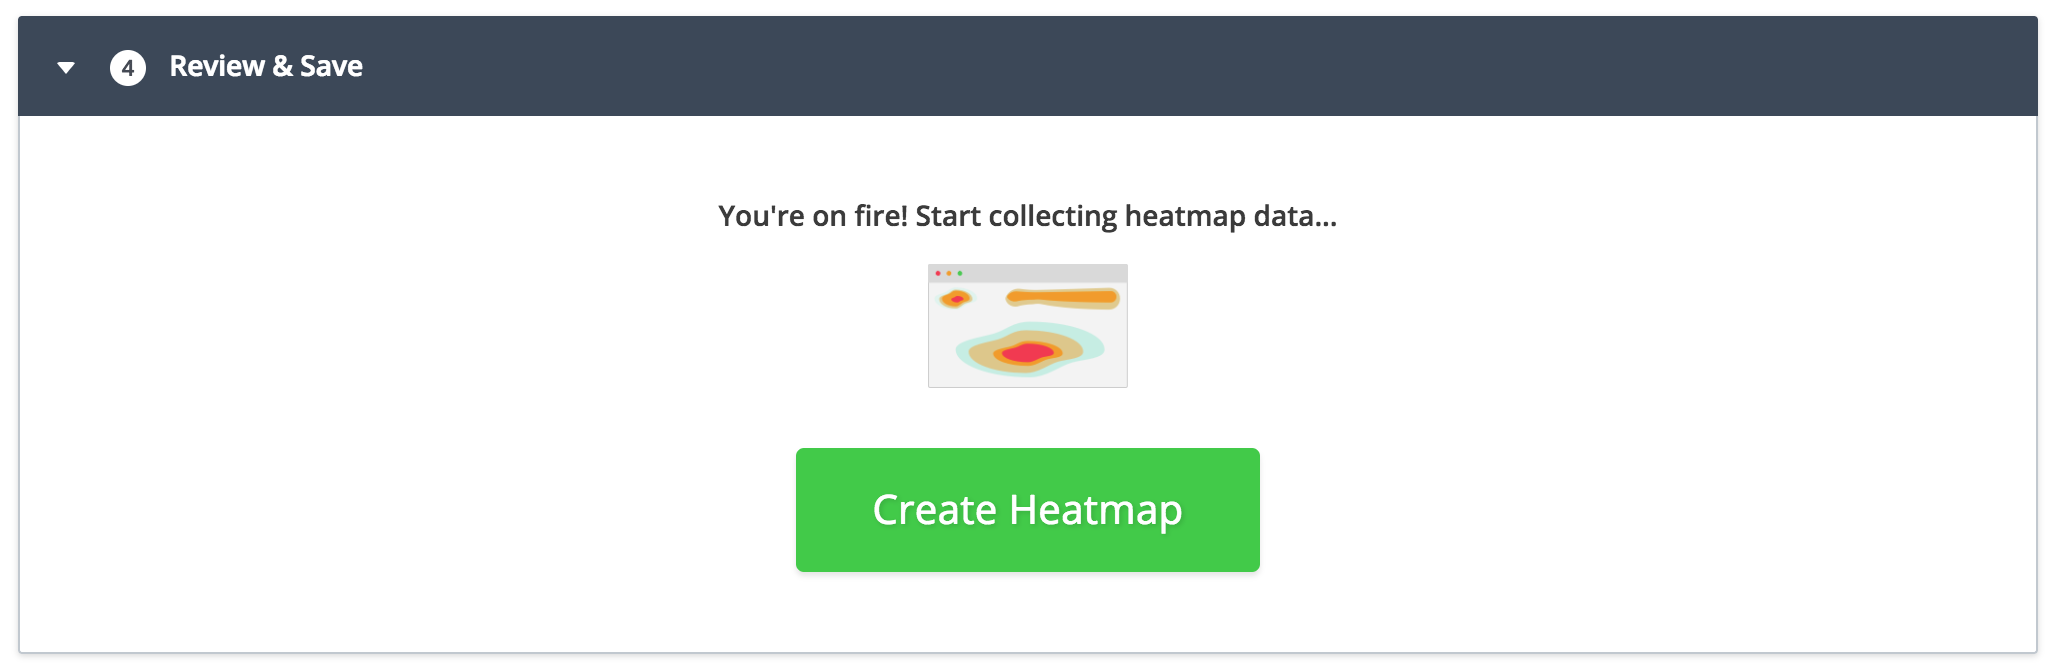
- If everything’s OK and ready to go: just click “Create Heatmap” and start collecting data!
Note: don’t worry, even if you mess up something (which is almost impossible by the way), it won’t impact your website layout and it definitely won’t hurt user experience. The only negative outcome could be that your heatmap will be broken.
That’s it! Come back and check your results in a week!
You will get three types of heatmaps automatically: a click, a scroll and a move heatmap – all automatically segmented by device type (desktop, mobile, tablet).
If you want to create a session recording, you can do it similarly, but in this menu:
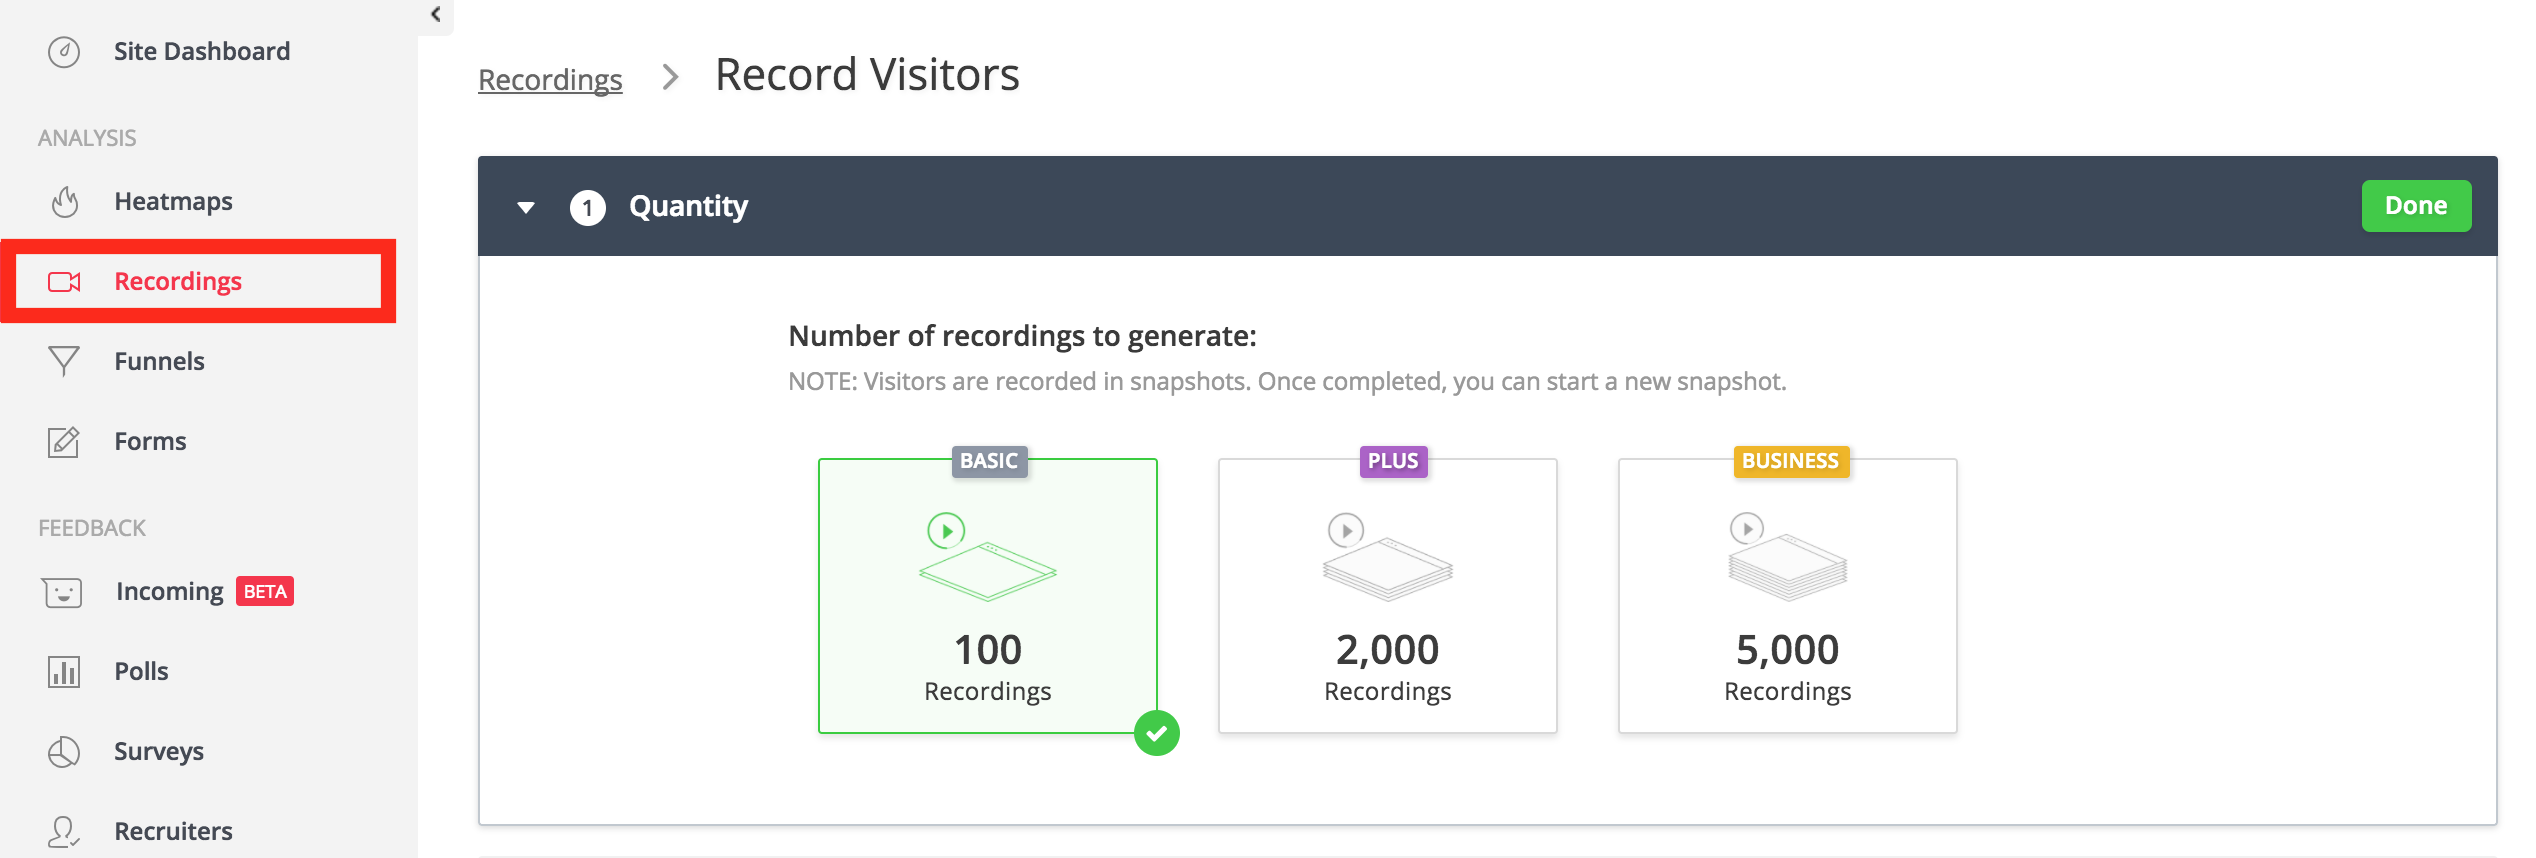
Note: I usually recommend recording 100 sessions only – sometimes 2,000… but I can assure you that you won’t watch 2,000 videos… ;-).
So how to profit from your heatmap data?
Again: if you run an analysis, you want to get business impact out of it. E.g. you want to prepare an A/B test with solid user data.
It’s not easy to give you exact guidelines on how to read your heatmap data without seeing the context, but for inspiration, here are four common scenarios I’ve seen in the last few years:
- If you see that more than 75% of clicks are going to your top menu on your start page…
At e-commerce businesses I have seen quite often that visitors click mostly the top menu after landing on the home page. If so, and if the top menu is not stuck to the top of the browser, it’s a good idea to try and make it sticky. (I A/B tested this many times, and in some cases it brought an instant +25% in revenue. I know… right?) - If you see less than 30% of people are scrolling…
Then try to move your most important content and USPs (Unique Selling Points) above the fold. You can test your above-the-fold content with five second testing, too. - Form analytics:
An easy way to understand your conversion funnels on your forms (e.g. registration forms) is to do it by counting the actual clicks on the different fields. Website heatmaps can help you out here, too. - If you see people are not clicking your CTAs.
Call-to-action buttons are the most crucial part of your website. First define what “not clicking CTAs” means! (Sometimes even a 2% click-rate counts as pretty good!)
If it’s still below your realistic expectations, then act on it. Let me bust the “red button is always better” myth here… Changing button colors usually do not fix users’ problems. To have more CTA clicks, try to focus on understanding your visitors’ problems and needs and improving the user experience.
As I’ve mentioned, these are just four common patterns I’ve seen quite a few times before. The aim was to give you a few ideas on how to profit from website heatmap projects. But don’t use these ideas without understanding the context…
Note: Plus, I highly recommend to A/B test every major change on your website to make sure that you actually increase your conversion rate.
Conclusion
Running website heatmaps is super-easy, super-useful and super-cost-effective for online businesses, so don’t hesitate to use it in your CRO projects!
Choosing any of the tools I’ve listed, you can start within 5 minutes. When you are using heatmaps, make sure it’s an integrated part of your user research strategy: do pre-studies (e.g. usability tests and Google Analytics reports) and understand that the point of all this research is to prepare better and more useful A/B tests!
- If you want to learn more about how to become a data scientist, take my 50-minute video course: How to Become a Data Scientist. (It’s free!)
- If you want to learn everything that you have to know about A/B testing (business elements, science elements, best practices, common mistakes, etc.) and become a real pro in building winning experiments, take my new online A/B testing course called A/B test like a Data Scientist!
Cheers,
Tomi Mester