
Are you running an online business?
Do you care about converting your new users into frequently returning users?
Great!
In that case customer retention analysis will play a significant role in your business.
A good retention strategy is easier to build on proper information and clean data — no question about that. The problem is that most people are doing their retention analyses wrong.
Well, I don’t blame them. It’s a tricky topic and it raises many, many questions:
- Is retention analysis important for you?
- How do you define retention?
- What is your correct retention time frame?
- How do you calculate your retention rate correctly?
- Which methods should you use? (Calculate ratios? Or go for a more complex cohort analysis?)
- Which tools should you use?
In this article I’ll answer all these questions – and more!
Note: If you are absolutely new to the topic of business data science, I recommend starting with my comprehensive introduction article: Data Science for Business. It’ll guide you through the important basics.
Why is customer retention analysis important for you?
I can’t imagine any serious online businesses where retention wouldn’t be crucial.
In any case: when a customer comes back to your service, that’s one of the strongest signals that she had a great experience with it.
But retention has an actual business impact, too.
There are some examples where this is more straightforward than in others. Just a few of these:
- If you have a subscription-based product (like Netflix), your revenue directly depends on your retention strategy.
- If you have an e-commerce store with multiple products (like Apple’s online store), your sales depends on whether your customers come back and buy again or not.
- If you have only one expensive, premium product to sell, your first sale depends on how many times you can promote and pitch your product to your prospects.
- If you are running online courses (like I do), the engagement of your students will depend on how often you can bring them back to your course – and make them successfully finish it. (So they can proudly tell their friends that they took and finished XY course.)
- …
I could tell you many, many more examples.
But I guess you get the point: retention is important.
To get good retention you need to have a strategy.
And to design a good strategy you need to know your numbers.
That’s why customer retention analysis is important for everyone.
How do you even define retention?
Let’s start at the beginning. Your number one question is:
In your business, how would you define retention?
What’s the user interaction that you will count as a return to your product or service?
- If you have a blog and you make money from serving ads and banners on your website, your retention metric will be something simple: a number around content consumption. This can be unique visits, unique sessions or something similar.
- On the other hand, if you have a multi-product e-commerce store, the number of returning visitors won’t give you enough information about the health of your business. Instead, you will have to have a closer eye on repeat purchases.
- Things can get complex, too.
Let’s imagine that you have a subscription-based product (like Netflix). In that case, your retention metric can be usage (e.g. watched another movie) — but it also makes sense to define it as renewing the subscription (e.g. paid another monthly fee). - …
As you can see, the definition of the right retention metric can differ from business to business.
To find the right one for you can be a challenging task.
When you are just starting off with your first retention analysis project, I recommend to go with common sense and to come up with the most logical metric by yourself. Later on, you can change that to a better one, based on data and research.
In my Data Strategy online course I talk more about how to define the retention metrics that best fit your business.
Retention time frame – where things get tricky
Okay, let’s say that you have defined your retention metric.
You have to answer another crucial question: what is your ideal retention time frame?
In other words: ideally, how much time elapses on average between two returns of the same user?
It’s not self-explanatory at all.
A few more examples:
- For music-streaming services (e.g. Spotify), it’s expected that customers will come back and use the service every day.
- The time frame will obviously be different for a taxi-booking application (e.g. Uber). In that case, expecting that users will use the service once a week, or even once a month, is more realistic.
- In extreme cases – for example, if you are developing an app for booking airline tickets – it could be also a totally healthy retention rate if you see users coming back to use your app only one or two times a year.
The retention time frame will differ from business to business, too!
Let me give you a few tips to figure out yours!
Note: Figuring out the correct retention time frame of your users will be very valuable for parts of your business other than analytics, too! Just think about your “win-back” marketing campaigns. After how much customer inactivity should you send out your reactivating emails, start your remarketing social campaigns, etc? If you start these “win-back” campaigns too early, you will annoy your customers, and if you start them too late, you may permanently lose lots of them! But if you know how often your “good users” return to you, then you will also know exactly when to ping the less active ones.
Find your ideal retention time frame!
How can you decide on the ideal retention time for your business?
In my experience, 4 things will help you with this:
1) Decide what you would like to achieve AND also what you believe to be realistic for your product.
That is, use common sense.
I know, this is not something that you hear from me or from any other data scientist very often. But still, when it comes to customer retention analysis, common sense plays an actual role. At least in the beginning.
2) Check your historical data!
Take groups of users who registered on the same day and analyze their retention time frames. (By the way, these groups are called “cohorts.” I’ll get back to cohorts later in this article.)
Here’s an example (from a fictional online business):
Take those users who registered on 2015-01-01 (Thursday). Calculate how many of these returned to your product again and again, and visualize when exactly they returned. (1 day later? 2 days later? 3 months later?)
On this chart below, you can see the monthly breakdown of returning users who registered on 2015-01-01.
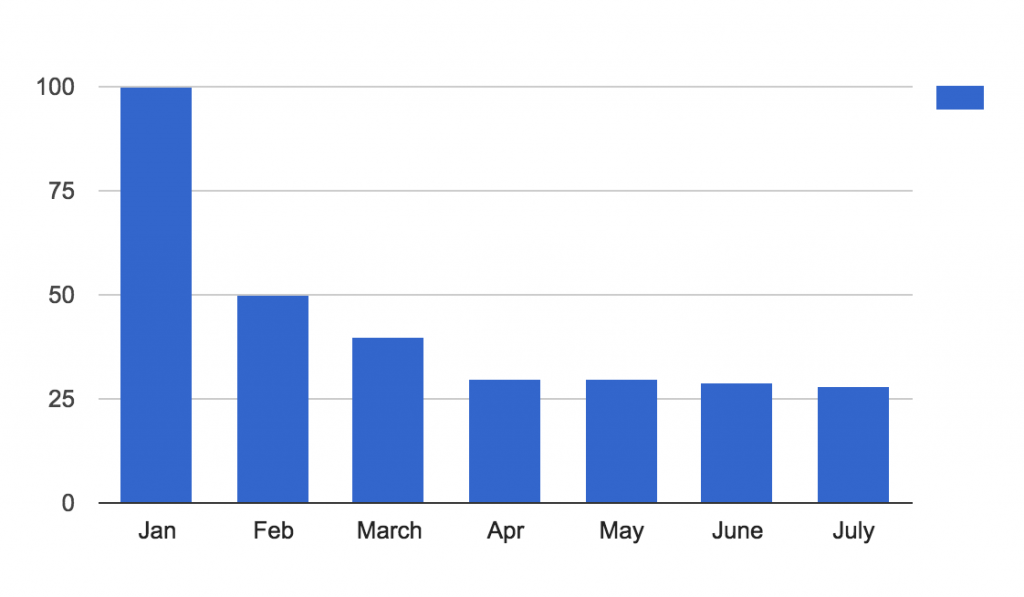
It seems this is too dense of a breakdown, since you can see that the number of users is decreasing each month… but you can’t really see the periodicity of returns. Let’s look at a weekly breakdown of the same report for the same 2015-01-01 cohort.
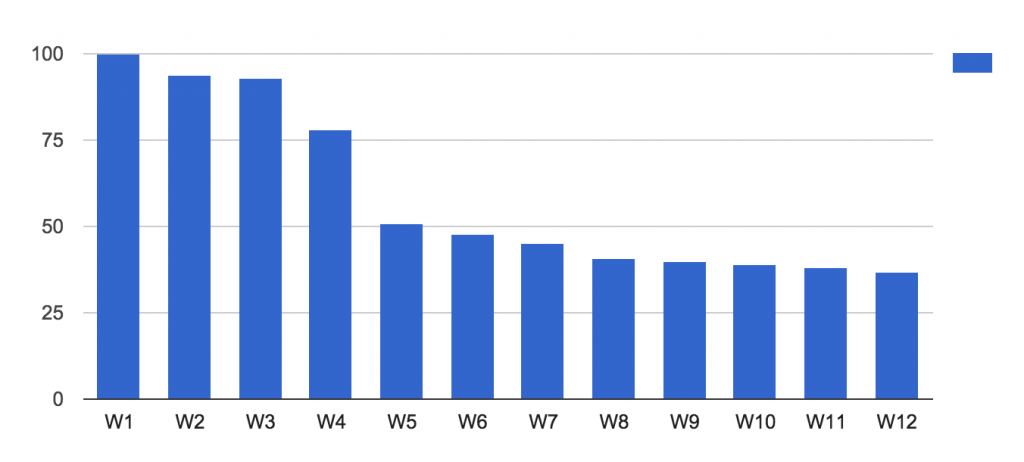
Still not the best. The situation is similar to before; we don’t see periodical returns, only a general reduction. Let’s go to the daily breakdown.
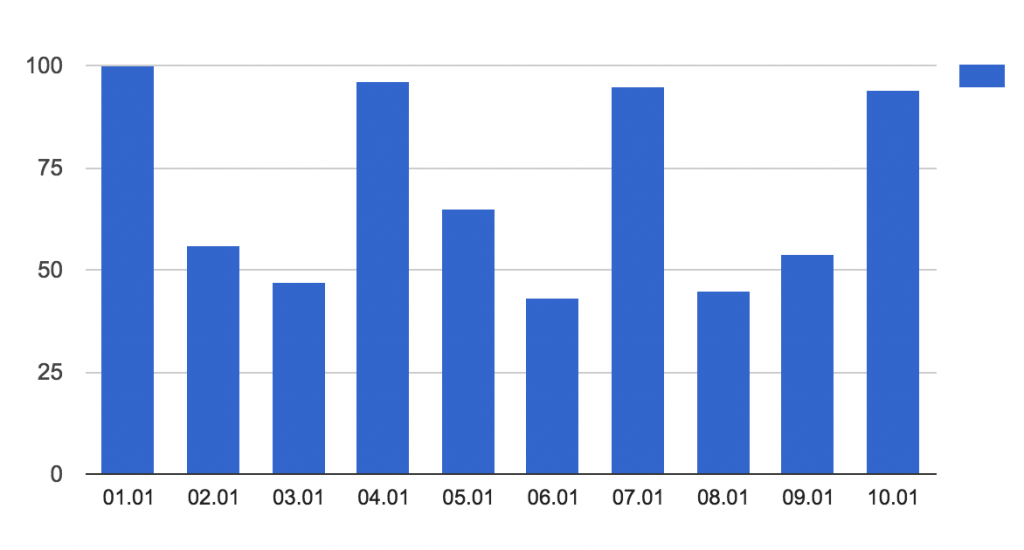
Jackpot! Here you can see some periodicity! Roughly every 3 days there’s a peak, so we can determine that the ideal time between 2 returns is 3 days.
(Of course, I simplified a bit, for the sake of the example – but I hope you get the point of this method now.)
3) If your diagram is not as straightforward as the chart above, and you end up with a really broad estimate – e.g. the retention time frame is somewhere between 8 and 20 days – then I would advise always choosing the smallest time frame that’s still realistic.
Why?
For one thing, the more frequently your users return the better for your business, right? So set a goal that represents that!
Secondly, if you go with a 20-day retention time, then you do an A/B-test, for instance – with a KPI of better retention – you’ll have to wait 20 days for the first data point… See? 8 days of waiting time is much more pleasant.
4) Check the market benchmarks! Sometimes it’s the most trivial solution, but we still forget about it. Find out what others choose as their optimal retention time, and why.
Okay, now you have your ideal time frame! The next question is…
How do you calculate retention rate?
When you start to actually calculate retention rate, you will run into another few questions, problems and pitfalls!
Let’s take a look at an example where – for the sake of discussion – we measure the daily retention rate.
There is one very common mistake I see people doing when calculating the daily retention rate:
People usually take Day #1 and Day #2 and simply check the difference of the Daily Active Users. E.g.:
- if I have
10.000daily active users on2016-01-12(Tuesday) - and I have
9.000daily active users on2016-01-13(Wednesday) - then my daily retention rate is:
90%…
NO! This math is INCORRECT!
Just think about it: what if 10.000 people registered on the 12th of January and none of them ever came back again. Then on the 13th of January an additional 9.000 people registered. Given that your true goal is to improve your daily retention rate, this is really bad news (since you are throwing money into those who register and never come back again).
However your incorrectly defined daily retention rate showed 90% — which would actually be really great news.
Pay attention and don’t lie to yourself: the simple difference between Daily Active Users won’t be enough to calculate your true retention rate.
Calculate Retention Rate Better (Still Technically Incorrect)
A slightly better solution is to calculate the Daily Retention Rate as below:
- I had
10.000daily active users on2016-01-12(Tuesday), but from these I will deduct those who are freshly registered users (those who registered on the very same day: 2016-01-12.) Let’s say2.000users. - I had
9.000daily active users on2016-01-13(Wednesday), but again: from these I will deduct those who just registered on the same day. Let’s say3.000users.
This way, my daily retention rate is:
((9.000 – 3.000) / (10.000 – 2.000)) = 75%
Of course this is still technically incorrect, as we are mixing together those returning users who have been with us every day for a year (so they’re very loyal) with those who may have only registered the day before yesterday (so they are not necessarily as committed).
Sometimes — especially at products that people use daily (e.g. social media apps) — this can work as a quick ballpark estimate, but in other cases this might be way off. So don’t use this 👆, use this 👇:
Cohort analysis – the best way to calculate retention rate
The only bullet-proof solution for calculating retention rates I’ve found through the years is: cohort analysis.
Before I go into details, it’s good to know that cohort analysis has one drawback… It’s a little bit hard to visualize it. (You will see that.)
But if you get your head around it, then it will become your favorite tool for running extremely precise customer retention analyses.
The essence of cohort analysis is that it groups users who share common characteristics (or experiences) within a defined time-span.
Easiest example: a cohort can be the users who registered for your service on the very same day (e.g. 2017-02-07).
This way whatever changes or testing we do to our product, we can separately measure how this affects the return of our loyal users (e.g. the continuously returning users of the cohort of 2017-02-07), and those who just recently registered. We can set the cohorts on a daily, weekly or monthly basis (e.g. “users who registered in March“) or alternatively we can define our own timeframe.
Let’s take look at a simple cohort analysis example
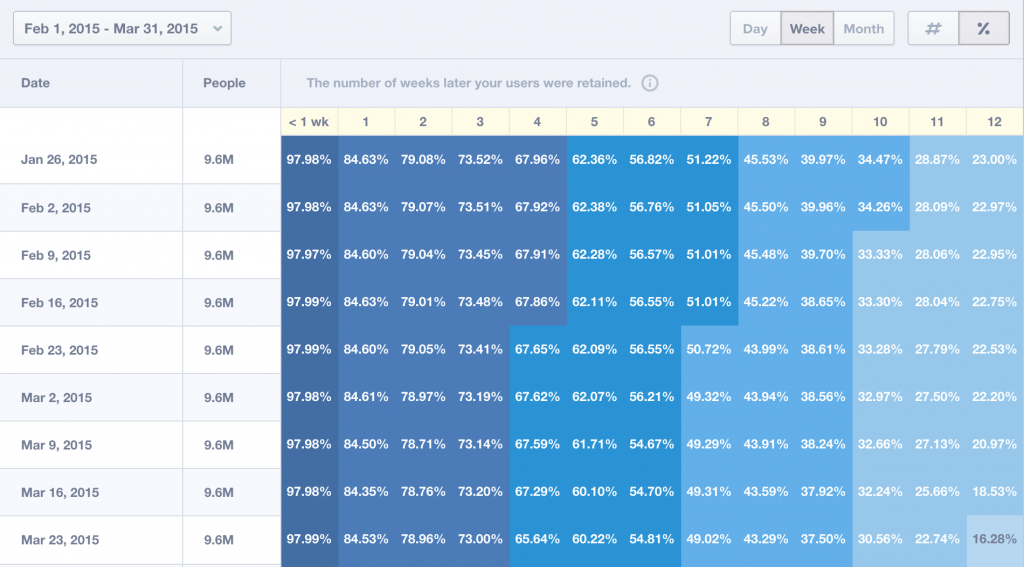
As you can see, here we have 9 different cohorts. It’s a weekly breakdown:
- Those users who registered during the week of the
2015-01-26(9.6 million users) - Those who registered during the week of the
2015-02-02(9.6 million users) - Those who registered during the week of the
2015-02-09, - And so on…
In the first row you can see that the cohort of the 2015-01-26 returned at a rate of 84.63% in the first week, 79.08% the second week, 73.52% the third week, and so on.
The rows underneath each other show the same trend for each cohort. This proves that this is the generic trend to the users of this given app.
But if you look more closely and compare the rows underneath each other, you can even discover a slight decrease, which could be seasonality, but it can also signal a bad trend (or even a bad marketing or product decision).
The point is:
the visualization might be tricky at first sight.
But when you start reading it you will realize that this report is clear and really informative. Cohort analysis is simply the best way to run customer retention analysis.
Cohort Analysis example
Here is a case study from an e-commerce store we worked with back in 2015. For them, cohort analysis was a real game changer – and we built a brand new retention strategy based on what we found out.
Note: the e-commerce sector is a really tough competitive market, so I had to replace the actual name of the company.
The Hiking Backpack E-Shop (note: this is a fictional name) began to analyze their data. They were curious about:
- What is the best target audience for them?
- What kind of product should they offer to whom and when?
- Having answered these two questions, how can they reach the highest revenue and higher customer retention rate in the long term?
The first thing they saw was that sales performance fluctuates throughout the year.
This can be for a number of reasons, of course, but knowing the circumstances our first thought was that this is due to the nature of the product. (Hiking is seasonal, right?) To validate our suspicions, we looked at the 2013 vs. 2014 revenue chart as a monthly breakdown. The two years show a similar trend (we only see small growth).
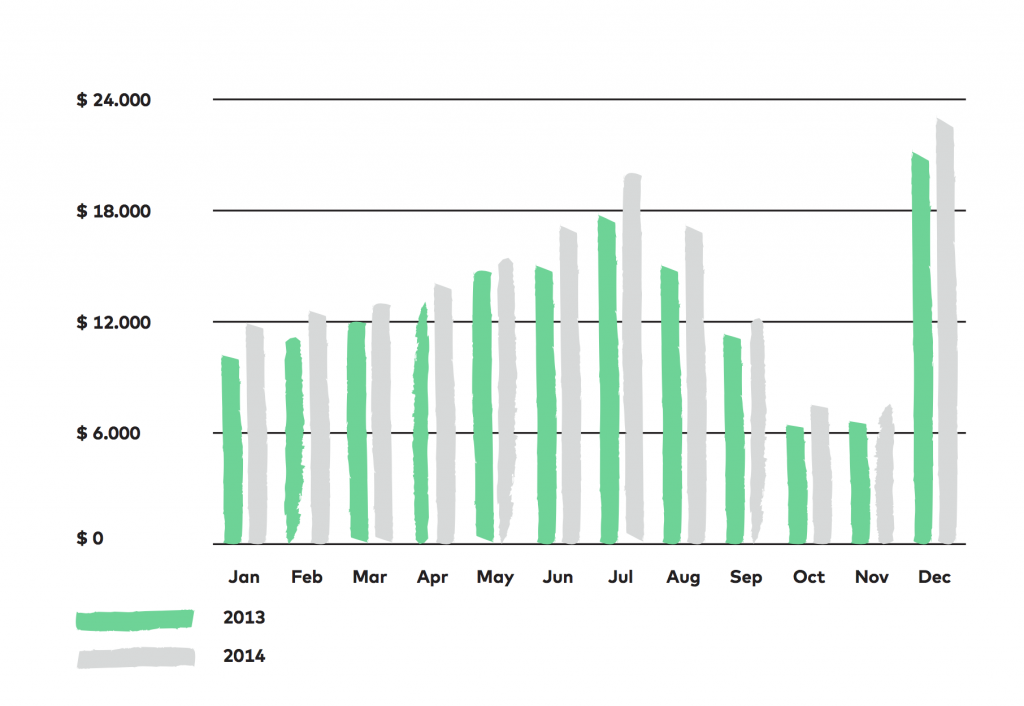
We’ve seen the same for 2012 and 2011 as well.
As always, we did a number of user interviews and usability tests, and checked some obvious analyses based on different hypotheses. Most of these didn’t give us any useful information – but one of the segmentations had an interesting result.
We segmented the revenue on the below chart based on purchase history.
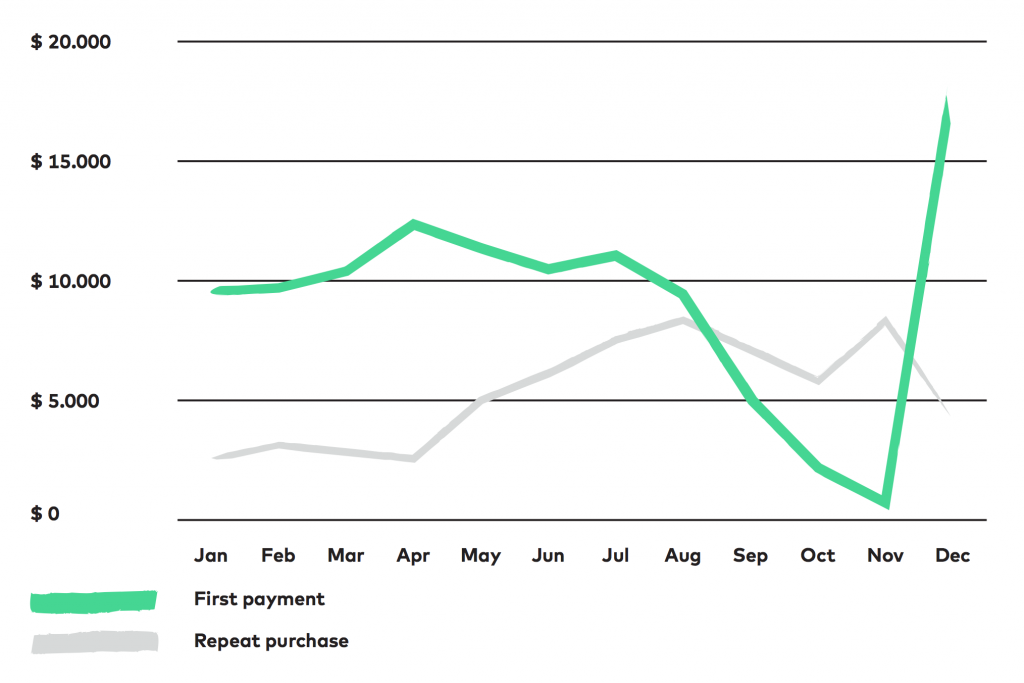
We can see that there was a constant change in 2014 on whether the “simple” first payments (the first purchase of a given customer) or the repeat purchase (when a returning customer purchased again) brought in more revenue.
It jumps out that the revenue generated by new customers drops in autumn, but returning customers cover this gap.
In light of this, we created a cohort analysis for those who made their first payment in the shop in 2014. We looked at exactly how much was spent the first time – and then second, third, fourth (and so on) times that they purchased something. We found this:
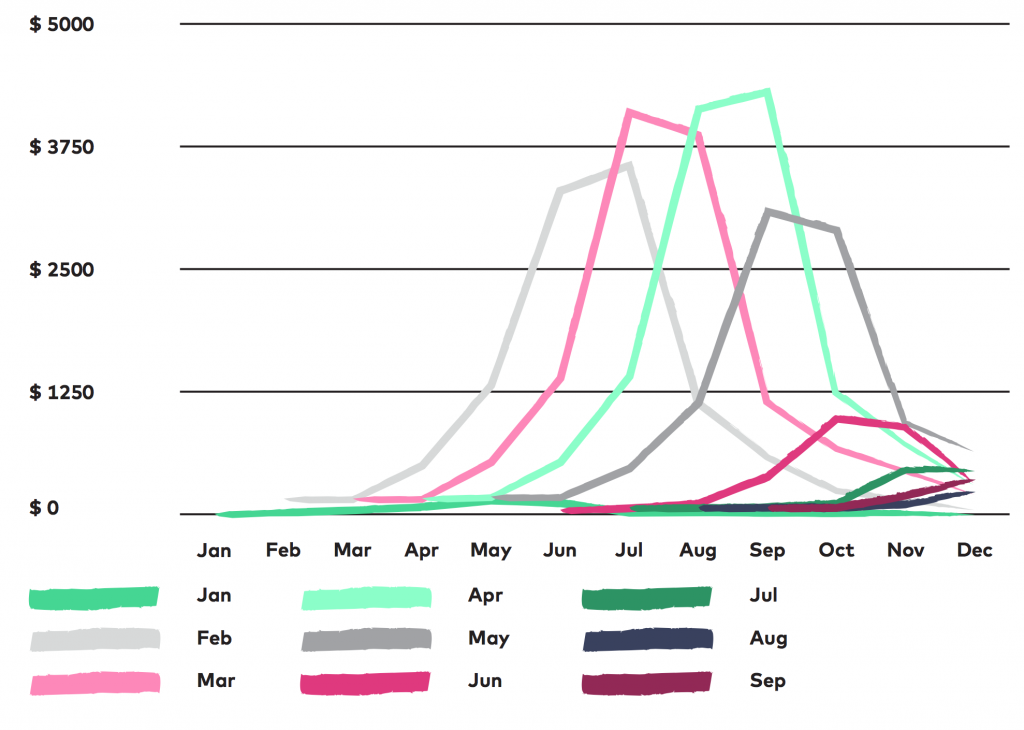
In 2014, customers spent the most on repeat purchases at the end of the summer and at the beginning of autumn. In fact, we also know that customers from February, March, April and May are really loyal and spend a lot 4-5 months after they make their first purchase (so in July, August, September and October).
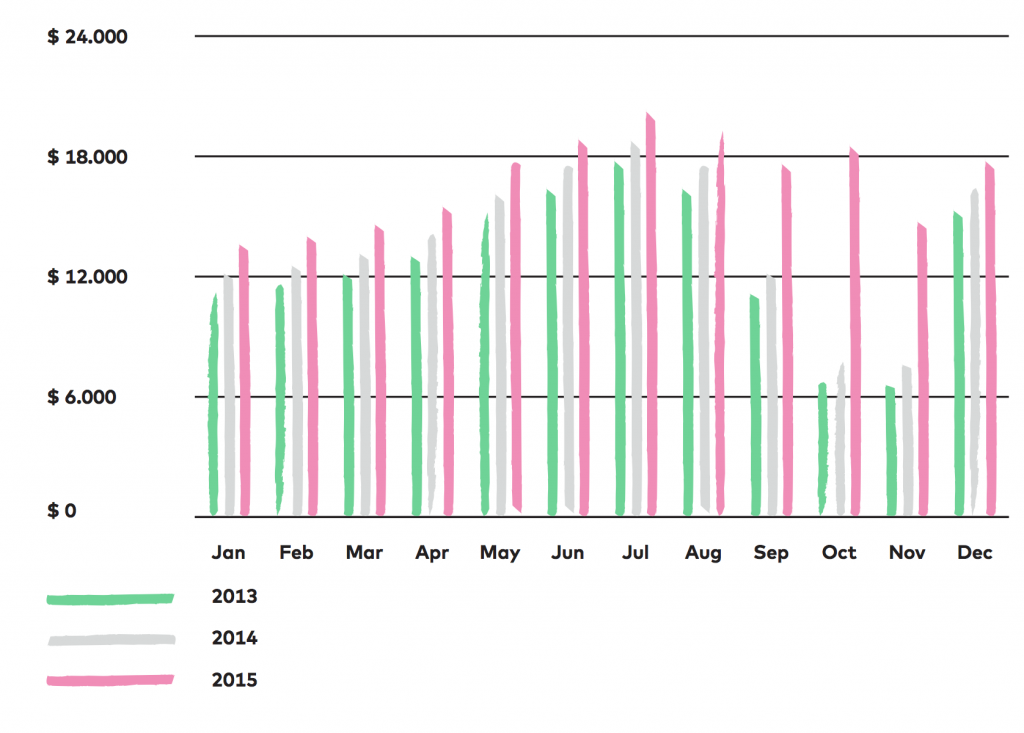
From this, two obvious suggestions followed.
One was to take a look at the same metrics, but over many years. (These also showed that customers who first bought gear between February and May came back and spent much more later in the year. We slowly realized that this means that they were the cohort who took hiking more seriously, planned their trips ahead of time, and bought their gear in advance. The rest shopped on an ad-hoc basis in the summer, or gave hiking backpacks as gifts, etc.)
The other was to figure out what other products can be sold to the loyal customers. This was a much simpler story. In short – we were able to find an easy-to-target customer group and also figure out what and when to sell to them again.
The autumn campaign of 2015 was approached with a brand new retention strategy. Instead of aiming at new customers, the pre-existing ones were targeted during these 3 months. This had its results.
Conclusion
As you can see, customer retention analysis is important and useful — and it can be also pretty difficult.
I hope this article helped you start to grapple with the problems and gave you some meaningful solutions. Now, I encourage you to go ahead and define your retention metric, figure out the correct time-frame for it, and run your first cohort analysis!
Good luck!
- If you want to learn more about how to become a data scientist, take my 50-minute video course: How to Become a Data Scientist. (It’s free!)
- Also check out my 6-week online course: The Junior Data Scientist’s First Month video course.
Cheers,
Tomi Mester
Cheers,
Tomi Mester