
Tamas Ujhelyi was a participant in my 6-week data science course (the Junior Data Scientist’s First Month). After finishing the course, he started a cool hobby project and he sent it over to us for a review. After going through it, I found it just the perfect example of a hobby project that junior data scientists need to boost their portfolio. It’s about web scraping (with BeautifulSoup and Python) and analyzing customer reviews.
Anyways: I asked Tamas to write an article and guide us through his project — so every Data36 reader can benefit from it. Enjoy!
Just like many people, I love reading books – but I never trust what I’ll read next to luck, because I don’t want to waste my time. So before deciding which book to pick up next, I always visit Goodreads and Moly to consult the wisdom of other fellow readers.
I’m pretty sure you’re familiar with Goodreads – it’s a website where readers can rate the books they’ve read and write reviews about them to share their reading experience.
Moly is the Hungarian equivalent of Goodreads. It means moth, and it’s a nice little pun, because in Hungary we say bookmoth instead of bookworm about someone who reads a lot. 🙂
But why is this important, you may ask…?
As someone who reads lots of book reviews, I’ve always wondered when people are more likely to write a review.
To put it more specifically: are readers more motivated to share their opinion when they liked a book or when they disliked or even hated their reading?
That’s exactly what I wanted to find out.
1. Libraries used in the project
You’ll find no surprises here, just the usual stuff for web scraping and data analysis. Feel free to skip this part if you’re more interested in the actual project.
Anyway, here’s the list:
1.1 Requests: to get the HTML content of web pages.
1.2 BeautifulSoup: to extract data from the HTML content of the requested web pages.
1.3 Re: to create regular expressions.
1.4 Counter (from collections): to count the number of reviews and ratings by rating value.
1.5 Pandas: to create dataframes from the extracted data.
1.6 Matplotlib: to visualize data.
1.7 NumPy: to make charts more readable.
1.8 Random: to test the findings of the project by creating random samples.
2. Getting the data with web scraping (Requests + BeautifulSoup)
Before getting into the technical details, I’d like to share with you some statistics about the project. The results you’ll soon read about are based on:
- 875 books,
- 18,872 scraped URLs,
- 56,782 reviews,
- 183,764 ratings.
A book’s rating by a reader is expressed in stars. Its possible values are:
- 5.0 (highest),
- 4.5,
- 4.0,
- 3.5,
- 3.0,
- 2.5,
- 2.0,
- 1.5,
- 1.0,
- 0.5,
- 0 (lowest).
A review is a reader’s written opinion about a book. Reviews are always associated with ratings, meaning that if someone writes a review she is also required to give a rating. Whenever I refer to a rating with review in this article, I mean the rating that’s associated with a written review.
For the analysis, I collected the ratings and reviews of 875 books. On moly.hu, each book has its own separate page, but their ratings and reviews can be accessed on special “review” URLs – these are what I call review pages from now on. I scraped 18,872 review pages in total.
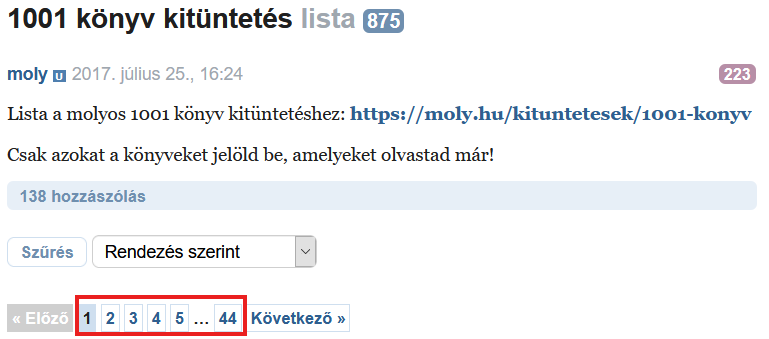
The books I included in the analysis can be found on the 1001 könyv kitüntetés (in English: 1001 books award) list. I chose this list because it contains diverse books from different authors and of different genres, so the findings of my analysis could be more easily generalized.
Now that we got all this out of the way, let’s get that data, shall we? 🙂
2.1 Collecting the books’ URLs
First, I had to get every book’s URL from the list. The books are listed on 44 pages:
With a simple while loop it was easy to get the URLs, and save them to book_urls for later use:
book_urls = []
page = 1
while page != 45:
    result = requests.get(f"https://moly.hu/listak/1001-konyv-kituntetes?page={str(page)}")
    time.sleep(1)
    src = result.content
    soup = BeautifulSoup(src, "lxml")
    all_a = soup.find_all("a", class_="fn book_selector")
    book_urls.extend(["https://moly.hu" + a["href"] for a in  all_a])
    page += 1
I used Requests and BeautifulSoup to scrape the pages, and collect the URLs of the books.
In case you are wondering, time.sleep(1) was needed for safety reasons: it stopped the code from running for 1 sec, so the scraping process didn’t overload the web server with requests.
After this piece of code had finished running, I had all 875 book URLs in the book_urls list:
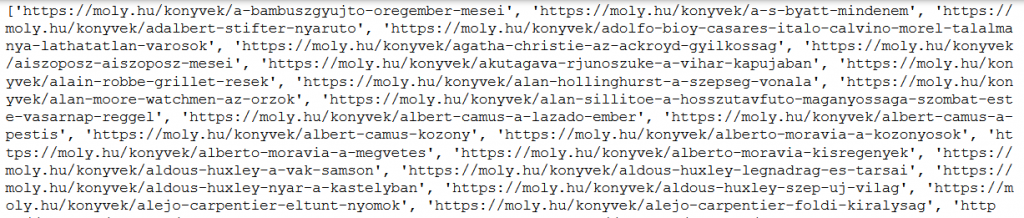
2.2 Extracting data for every book
Having gathered all books’ URLs, I could move on with the analysis by looping through book_urls with a for loop.
For every book I created a book dictionary in which I stored the following data:
- the book’s title (
book[“title”], string variable), - the book’s URL (
book[“url”], string variable), - the book’s ratings (
book[“ratings”], list variable), - the book’s ratings with reviews (
book[“reviews”], list variable).
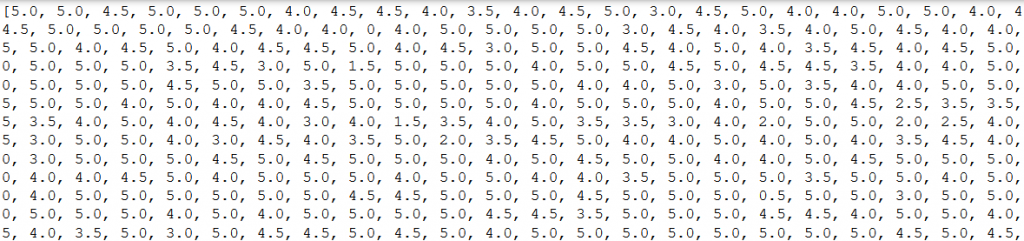
Just to make it easier for you to imagine, this is what the book dictionary looked like by the end of a loop iteration:
{
'title': 'A bambuszgyűjtő öregember meséi',
'url': 'https://moly.hu/konyvek/a-bambuszgyujto-oregember-mesei',
'ratings': [5.0, 5.0, 4.5, 5.0, 5.0, 5.0, 4.0, 4.5, 4.5, 4.0, 3.5, 4.0, 4.5, 5.0, 3.0, 4.5, 5.0, 4.0, 4.0, 5.0, 5.0, 4.0, 4.5, 4.5, 5.0, 5.0, 5.0, 5.0, 4.5, 4.0, 4.0, 0, 4.0, 5.0, 5.0, 5.0, 5.0, 3.0, 4.5, 4.0, 3.5, 4.0, 5.0, 4.5, 4.0, 4.0, 4.5, 5.0, 4.0, 4.5, 5.0, 4.0, 4.5, 4.5, 5.0, 4.0, 4.5, 3.0, 5.0, 5.0, 4.5, 4.0, 5.0, 4.0, 3.5],
'reviews': [5.0, 5.0, 5.0, 5.0, 5.0, 4.0, 4.5, 5.0, 4.5, 5.0, 4.0, 4.0, 5.0, 5.0, 4.0, 4.5, 5.0, 5.0, 5.0, 4.5, 0, 5.0, 5.0, 5.0, 3.0, 4.0, 5.0, 4.0, 4.0, 5.0, 4.5, 5.0, 4.5, 4.0, 3.0, 5.0]
}
After a book dictionary was created, I added (books.append(book)) it to the books list which I’d created before and outside of the for loop, so that later I could access all books.
All you have to remember is that I created a book dictionary for all 875 books. If you’re interested in a more detailed explanation, here’s how I did it step by step. If not, it’s completely fine, too – just skip to the next section: 2.3 Creating dataframes.
So, as the first step I created the books and the review_pages list, then the star_values dictionary:
books = []
review_pages = []
star_values = {
    "80" : 5.0,
    "72" : 4.5,
    "64" : 4.0,
    "56" : 3.5,
    "48" : 3.0,
    "40" : 2.5,
    "32" : 2.0,
    "24" : 1.5,
    "16" : 1.0,
    "8" : 0.5,
    "0" : 0
}
I needed books to store every book that I got after each loop iteration. In all honesty, I didn’t end up using review_pages, because I only needed it as a backup in case I had to redo the scraping process – I didn’t want to lose the URLs I had already collected, so I saved every review page URL here (remember, review pages are the pages where a book’s ratings and reviews can be found).
star_values was needed for a different purpose, just look at this screenshot from a review page’s source code:
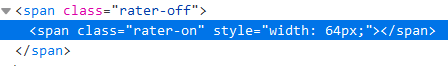
Every rating is defined by its width in pixels: a rating of 5.0 is 80px wide, a rating of 4.5 is 72px wide, a rating of 4.0 is 64px wide, you get the idea…
With BeautifulSoup, I could only get the width of a rating, so I used star_values to translate the width of the rating HTML element to its real rating value (for instance, 80px was translated to a rating of 5.0):
star_value = star_values[review.find("span", class_="rater-on")["style"].split(" ", 1)[1].split("px;", 1)[0]]
Let’s keep moving. 🙂
In the for loop that I’ve already mentioned, I first created a book dictionary, a book_ratings and a book_reviews list:
book = {}
book_ratings = []
book_reviews = []
I’ve already discussed these, so on to the next section: this is where I set up the scraping part of the code. I requested a book’s URL with requests.get(book_url), parsed the book’s web page with BeautifulSoup, then saved its URL into book[“url”] and its title into book[“title”]:
result = requests.get(book_url)
src = result.content
soup = BeautifulSoup(src, "lxml")
book["title"] = soup.find("h1").find("span").get_text().rstrip().replace("\u200b", "")
book["url"] = book_url
After this, I saved the book’s first review page URL into the soup variable:
page = 1
result = requests.get(f"{book_url}/ertekelesek?page={str(page)}")
time.sleep(1)
src = result.content
soup = BeautifulSoup(src, "lxml")
As the next step, I checked with a try-except-else block if there was more than one review page for the book (this was necessary, because depending on the answer, a different code block had to run):
try:
    last_page = int(soup.find("a", class_="next_page").previous_sibling.previous_sibling.get_text())
If according to try there was no or at most one review page for a book, the except block ran:
except AttributeError:
    url = f"{book_url}/ertekelesek?page={str(page)}"
    reviews = soup.find_all("div", id=re.compile("^review_"))
    if len(reviews) != 0:
        review_pages.append(url)
    for review in reviews:
        star_value = star_values[review.find("span", class_="rater-on")["style"].split(" ", 1)[1].split("px;", 1)[0]]
        book_ratings.append(star_value)
        if review.find("div", class_="atom"):
            book_reviews.append(star_value)
If according to try there was more than one review page for a book, the else block ran:
else:
    while page != last_page + 1:
    url = f"{book_url}/ertekelesek?page={str(page)}"
    review_pages.append(url)
    result = requests.get(url)
    time.sleep(1)
    src = result.content
    soup = BeautifulSoup(src, "lxml")
    reviews = soup.find_all("div", id=re.compile("^review_"))
    for review in reviews:
        star_value = star_values[review.find("span", class_="rater-on")["style"].split(" ", 1)[1].split("px;", 1)[0]]
        book_ratings.append(star_value)
        if review.find("div", class_="atom"):
            book_reviews.append(star_value)
    page += 1
In either case, the result was the same: the review pages were added to the review_pages list (for safety reasons to not lose data), the ratings and the ratings with reviews were added to book_ratings and book_reviews respectively.
Then, as the final touch, book was finalized with book_ratings and book_reviews data, and appended to books, a list that contained all books after the for loop was done running:
book["ratings"] = book_ratings
book["reviews"] = book_reviews
books.append(book)
I can imagine this was a lot to take in, but bear with me, it gets better. 🙂
2.3 Creating dataframes with Pandas
By this time I had 875 book dictionaries in a list (books) with every book’s title, URL, ratings and ratings with reviews.
The next step was an easy one – I stored every rating and rating with review of each book in two separate lists:
all_reviews = []
all_ratings = []
for book in books:
    all_ratings.extend(book["ratings"])
    all_reviews.extend(book["reviews"])
After printing, all_reviews and all_ratings look like this:
all_reviews holds 56,782 ratings with reviews, while all_ratings contains 183,765 ratings.
I used Counter() to count the number of occurrences of the ratings in all_ratings and all_reviews, then converted the results to dictionaries with the dict() function:
c_all_ratings = Counter(all_ratings)
c_all_reviews = Counter(all_reviews)
all_ratings_dict = dict(c_all_ratings)
all_reviews_dict = dict(c_all_reviews)
The results look like this (the below code shows the result for all_ratings_dict):
{5.0: 76783, 4.5: 31517, 4.0: 35901, 3.5: 15286, 3.0: 11813, 0: 2237, 1.5: 945, 2.5: 3800, 2.0: 3261, 0.5: 983, 1.0: 1238}
This means that altogether there were, at the time of the project, 76,783 ratings with a value of 5.0, 31,517 ratings with a value of 4.5, and so on and so forth.
What’s more important is that based on all_ratings_dict and all_reviews_dict I could finally create the dataframes I needed for the later visualizations.
To create the initial dataframes I used the following code:
d = {"Rating" : [5.0, 4.5, 4.0, 3.5, 3.0, 2.5, 2.0, 1.5, 1.0, 0.5, 0.0], "# of ratings" : [76783, 31517, 35901, 15286, 11813, 3800, 3261, 945, 1238, 983, 2237], "# of ratings with reviews" : [23509, 9200, 9818, 4258, 3852, 1393, 1256, 389, 494, 440, 2173]}
df = pd.DataFrame(data=d)
df["# of ratings with reviews / # of ratings"] = df["# of ratings with reviews"] / df["# of ratings"]
df
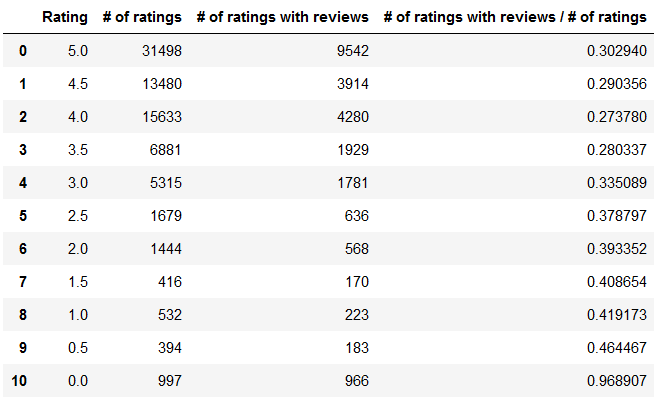
And this is the dataframe I got:
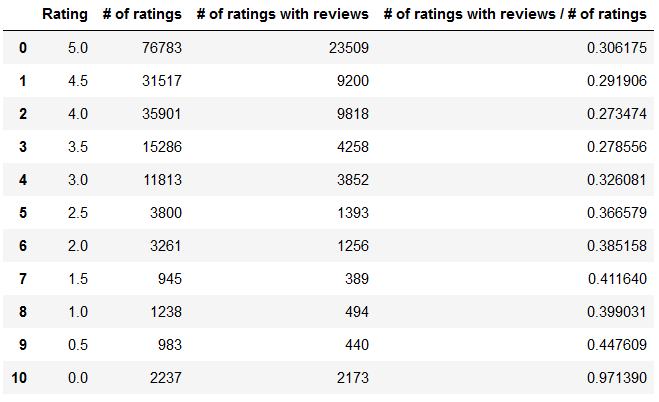
The Rating column shows the possible values of the ratings in decreasing order (from 5.0 to 0.0).
The # of ratings column shows how many ratings there are for each rating (for example there are 2,237 ratings with the value of 0.0).
The # of ratings with reviews column shows how many ratings there are with reviews (for example there are 2,173 ratings where there’s also a review with the value of 0.0).
The # of ratings with reviews / # of ratings column shows for each rating what percentage of all ratings contains a review, too (for example around 30% of all ratings of 5.0 contained a review, which means that 70% of 5.0 ratings don’t contain a review).
You may already see the pattern here: as the value of Rating decreases (the ratings become more negative), people tend to write more reviews (as the increase of # of ratings with reviews / # of ratings indicates).
But let’s not get ahead of ourselves just yet. 😉
After a little tweaking I managed to improve on the previous dataframe by first creating two new variables (number_of_all_ratings which is 183,764 as we already know, number_of_all_ratings_with_reviews which is 56,782):
number_of_all_ratings = df["# of ratings"].sum()
number_of_all_ratings_with_reviews = df["# of ratings with reviews"].sum()
Then I did some new calculations with these variables:
df.insert(2, "% of all ratings", df["# of ratings"] / number_of_all_ratings * 100)
df.insert(4, "% of all ratings with reviews", df["# of ratings with reviews"] / number_of_all_ratings_with_reviews * 100)
Here’s the end result with two new columns (% of all ratings and % of all ratings with reviews):
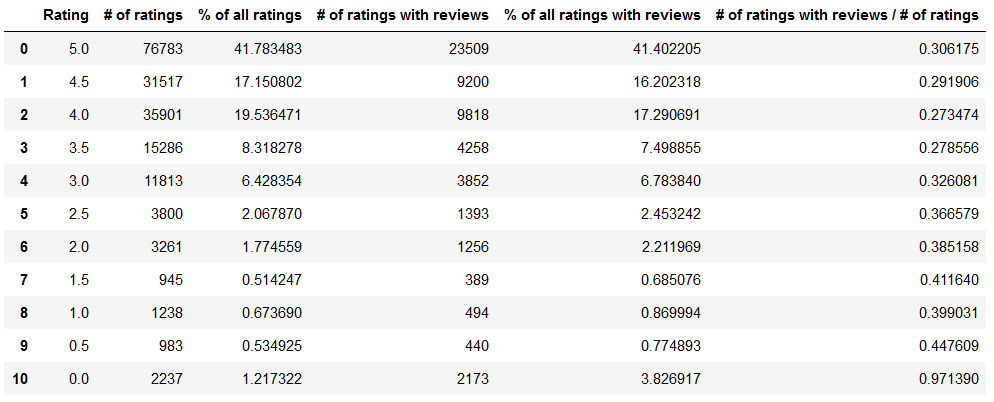
The % of all ratings column shows for each Rating what percentage the given rating (# of ratings) takes up of all ratings (number_of_all_ratings). For example out of all ratings 3.0 accounts for 6.43%.
The % of all ratings with reviews shows for each Rating what percentage the given rating (# of ratings with reviews) takes up of all ratings with reviews (number_of_all_ratings_with_reviews). For example out of all ratings with reviews 4.0 accounts for 17.29%.
After I had created the above dataframes, I could finally start visualizing the data.
3. Visualizing the data with Matplotlib
First, I wanted to visualize # of ratings with reviews / # of ratings from my dataframe (remember, this column shows for each rating what percentage of all ratings contains a review).
This is the code I used for plotting the data:
plt.figure(figsize=(10, 6))
plt.title("Reviews / ratings by star rating")
plt.xticks(np.arange(0, 5.5, step=0.5))
plt.scatter(df["Rating"], df["# of ratings with reviews / # of ratings"])
plt.plot(df["Rating"], df["# of ratings with reviews / # of ratings"])
plt.xlabel("Rating")
plt.ylabel("Percentage")
And this is what the plot looks like:
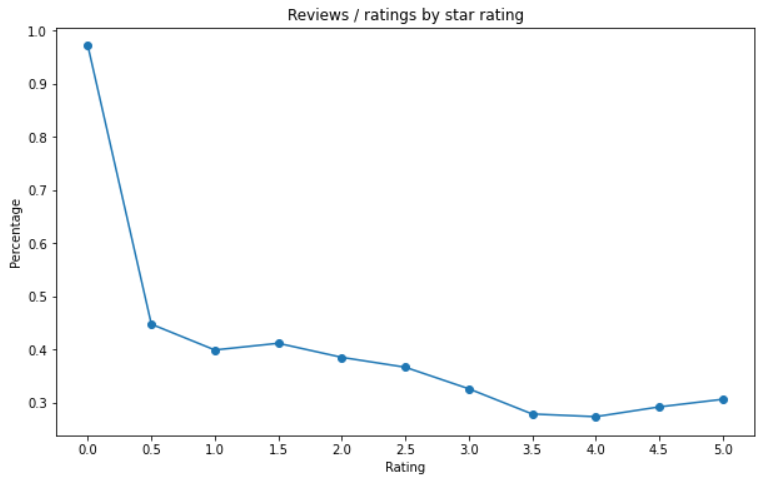
The chart nicely shows which rating is associated with the most reviews (expressed in percentage). We can see that people are more inclined to write a comment if their experience with a book is negative (their rating is 2.5 or lower).
I’d like to mention that it needs further investigation why readers who gave a rating of 0 write reviews such a high percentage of the time (97%). During my project I’ve encountered both positive and negative reviews with a rating of 0, but I haven’t done extensive research into this, so this question remains to be answered.
Anyway, I made another chart that I find interesting:

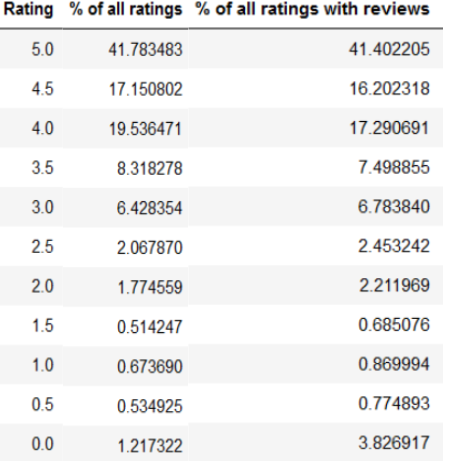
This chart shows that the distribution of the reviews and the distribution of the ratings are not the same. If we compare % of all ratings with % of all ratings with reviews, we can suspect that worse ratings (typically from 3.0 to 0) tend to receive more reviews (compared to the number of all ratings).
Perhaps the dataframe version of this data is more illuminating:
This is the code I used to plot the above chart (in creating this chart, Python Tutorials’ article helped me a lot):
y = df["% of all ratings"]
y2 = df["% of all ratings with reviews"]
x = df["Rating"]
fig = plt.figure(figsize=(10, 6))
ax = plt.subplot(111)
ax.plot(x, y, label="% of all ratings")
ax.plot(x, y2, label="% of all ratings with reviews")
plt.title("% of all ratings vs % of all ratings with reviews by star rating")
plt.xticks(np.arange(0, 5.5, step=0.5))
plt.xlabel("Rating")
plt.ylabel("Percentage")
ax.legend()
plt.show()
4. Validating the results with random sampling
Naturally, the results I got from my analysis needed to be validated statistically. Tomi Mester suggested that I randomly select some books from all 875 books, carry out the same analysis I did for all books, and check if the results are more or less similar to my original results.
If I repeat this process 10 times, and the results I get are consistent, my original sample can be considered big enough to draw conclusions based on it.
That’s exactly what I did – I created a randomize() function, where I randomly picked 400 books with random.sample(), and performed the same analysis I did for all 875 books.
Every randomize() function returned a dataframe, and added the sample’s value of # of ratings with reviews / # of ratings for each Rating to predefined lists. Each list was associated with a rating value (for example “3.0”), and held the related values received from the randomize() functions. After the 10 random samplings, I printed the results of each list to check if my original sample of 875 books was big enough.
Here’s what a dataframe returned by randomize() looked like:
And this is the code itself:
five = []
four_and_a_half = []
four = []
three_and_a_half = []
three = []
two_and_a_half = []
two = []
one_and_a_half = []
one = []
half = []
zero = []
def randomize():
    sample_books = random.sample(books, k=400)
    sample_ratings = []
    sample_reviews = []
    for book in sample_books:
        sample_ratings.extend(book["ratings"])
        sample_reviews.extend(book["reviews"])
    ratings_counted = dict(Counter(sample_ratings))
    reviews_counted = dict(Counter(sample_reviews))
    d = {"Rating" : [5.0, 4.5, 4.0, 3.5, 3.0, 2.5, 2.0, 1.5, 1.0, 0.5, 0.0], "# of ratings" : [ratings_counted[5.0], ratings_counted[4.5], ratings_counted[4.0], ratings_counted[3.5], ratings_counted[3.0], ratings_counted[2.5], ratings_counted[2.0], ratings_counted[1.5], ratings_counted[1.0], ratings_counted[0.5], ratings_counted[0]], "# of ratings with reviews" : [reviews_counted[5.0], reviews_counted[4.5], reviews_counted[4.0], reviews_counted[3.5], reviews_counted[3.0], reviews_counted[2.5], reviews_counted[2.0], reviews_counted[1.5], reviews_counted[1.0], reviews_counted[0.5], reviews_counted[0]]}
    df = pd.DataFrame(data=d)
    df["# of ratings with reviews / # of ratings"] = df["# of ratings with reviews"] / df["# of ratings"]
    v = df["# of ratings with reviews / # of ratings"]
    five.append(round(v[0], 4))
    four_and_a_half.append(round(v[1], 4))
    four.append(round(v[2], 4))
    three_and_a_half.append(round(v[3], 4))
    three.append(round(v[4], 4))
    two_and_a_half.append(round(v[5], 4))
    two.append(round(v[6], 4))
    one_and_a_half.append(round(v[7], 4))
    one.append(round(v[8], 4))
    half.append(round(v[9], 4))
    zero.append(round(v[10], 4))
    return df
After I ran randomize() 10 times, I printed the results:
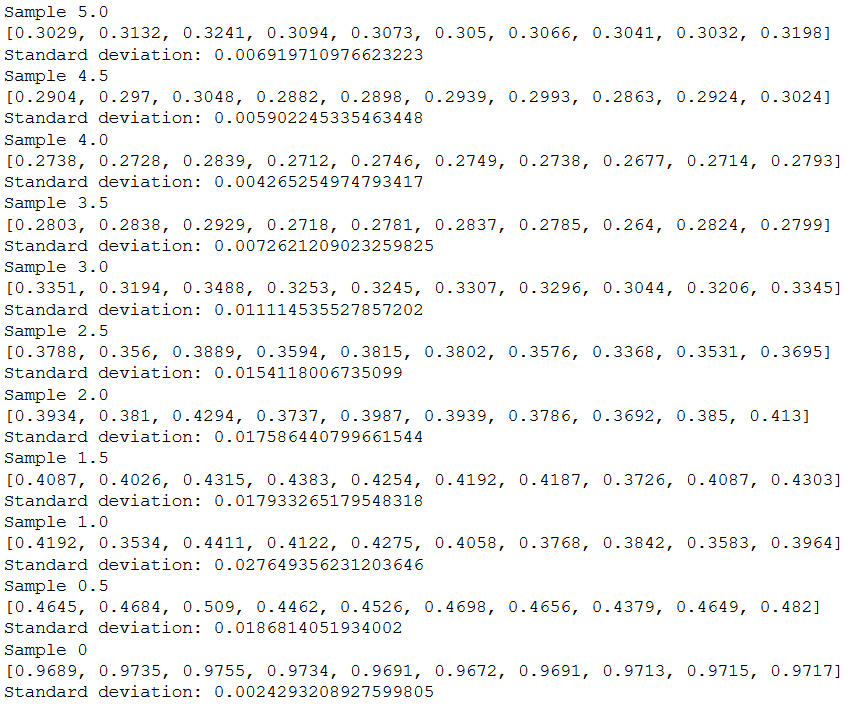
Samples are shown for every rating value (for instance “Sample 5.0” means 10 samples for the rating of “5.0”).
The list values (for instance “0.3029”) are the ratio of # of ratings with reviews / # of ratings, created by randomize() 10 times.
The standard deviation shows that the distance between the values are very small, thus my sample of 875 books for the project can be considered big enough, and the conclusion that people are more likely to write a review if their rating of a book is rather negative can be accepted.
Conclusion
There’s nothing special left to say, so I’d like to repeat the main takeaway of my analysis:
- People are more inclined to write a review if their experience with a book is negative (their rating is 3.0 or lower).
This sounds nice, but we can never be 100% sure about any conclusion, so further analyses are always welcome. 🙂
I’d like to thank Tomi Mester for his help. He was kind enough to answer my questions regarding the project, and suggest to me what directions my project could possibly take next.
If you’re interested to learn more about data science, Tomi’s highly practical and beginner-friendly course should be the place where you start your data science journey. Good luck and have fun!
Cheers,
Tamas Ujhelyi