
I ran a data driven test a few weeks ago at the startup where I work, where I tried to drive paid app installs. Along the way I realized that different tools (Facebook, Branch and iTunes Connect) gave me different results for the very same metric. I had to dig deeper to understand what was happening. Here’s the full story.
If we look at the definition of literacy, we will find this in the textbooks:
“the ability to read for knowledge, write coherently and think critically about printed material”.
If we translate it to world of data, than data-literacy is the ability to consume for knowledge, produce coherently and think critically about data. It includes statistical literacy but also understanding how to work with large data sets, how they were produced, how to connect data sets and how to interpret them.
When we read blogposts on product development stories or successful marketing campaigns (aka “How we increased sales by 1500% with a zero budget) that are metrics and analytics based, we tend to overlook that some of the data published might be inaccurate or misleading.
In many cases the reason behind is that people just don’t know that the stats they are collecting are inaccurate or even wrong. I want to share a story with you that happened to me a few days ago at Shapr3D where we develop a CAD application for iPad Pro.
Understanding Data discrepancies
TLDR:
We were using 3 different tools for tracking the very same thing. But ended up with very different results.
Overview
I was running a Facebook ad to drive successful app installs. To track this I was using Facebook’s Power Editor, Branch.io a deeplinking solution and iTunes Connect Analytics, Apple’s own app analytics platform.
The Setup
I wanted to be able to track users from the very beginning, all the way to the end. In order to do this, I followed their journey.
- Users clicks on targeted Facebook Ad.
- Lands on the Apple App Store
- Downloads the app
In order to track everything, I had to setup tracking in reverse order.
1. Create a campaign in iTunes Connect with the Campaign Generator. Think of it as UTM for Google Analytics (https://analytics.itunes.apple.com/#/campaigngenerator). You have to be logged in to use it and you can create a campaign that tags your link.
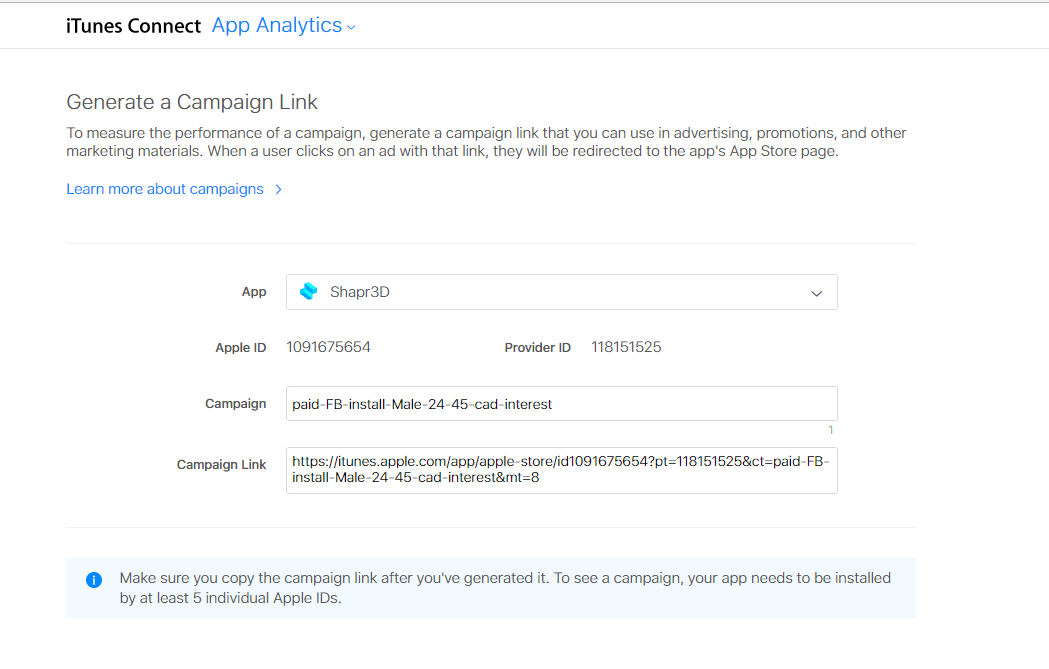
To test many things at scale, I even created a tagging template with a concatenate Excel function, where I would use different parameters like age, gender, source, type and interest.
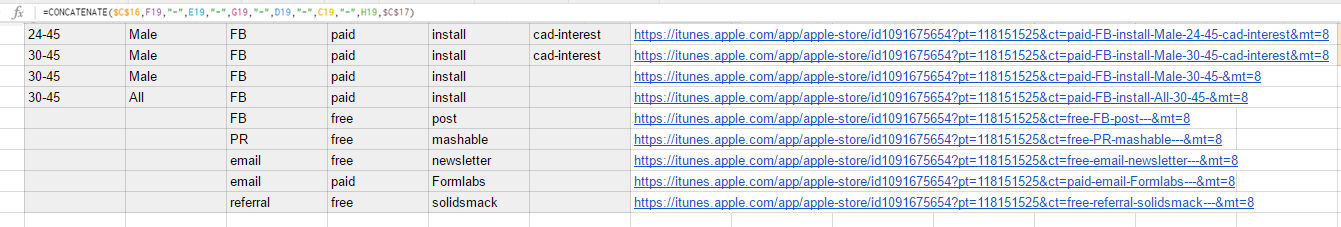
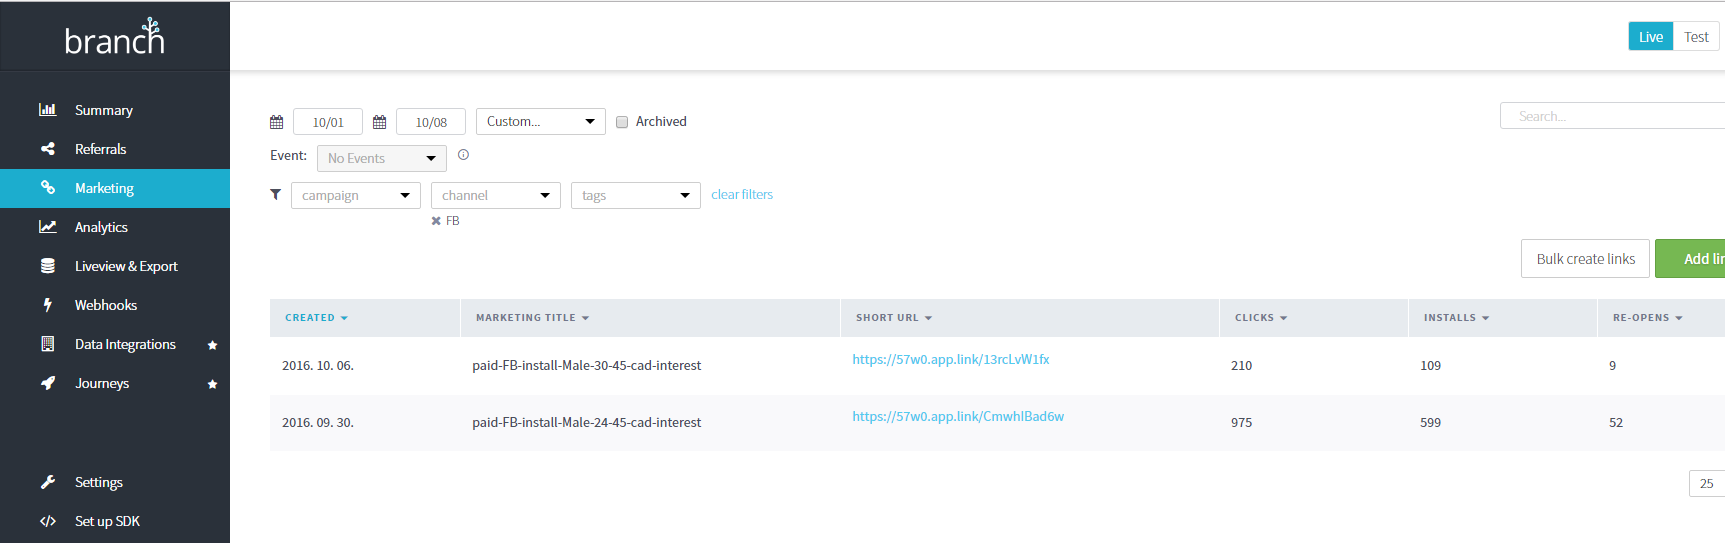
2. Then I went to Branch, a deeplinking solution, where I used these exact links and entered them there as well. What happens here is that I use two tracking solutions one after the other.
The good thing about Branch and deeplinking is that if someone has the App already installed, you can send them directly to the app and not to a download page for example. It is extremely useful for push notifications and other messaging when you want people to land in your app.
Here I create new links based on my tagging Spreadsheet. Ideally, what would happen is that people click on the branch link, that redirects them to my tagged link which tracks the users. Simple as that.
3. Lastly I used these Branch links as the links for the Facebook Ads. So I wouldn’t just send people to the Shapr3D App Download page, but if:
- They had the app installed, I would send them to the app directly
- If they don’t have it, they would land on the App Store
- But it would the tagged link, so I could better identify them by the campaign ID
It all seemed easy and nice. And then I ran two test campaigns and got really frustrated. Really frustrated.
The Results
These are actual data from 2 campaigns that I ran a few weeks ago.
You can see that I was using Facebook, Branch and iTunes Connect the very same thing. Successful app installs.
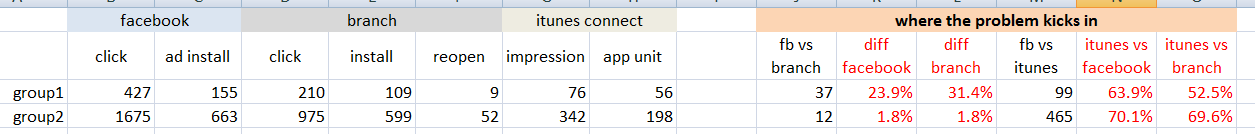
Here’s what I got for group1.
Facebook reported: 155 installs
Branch: 109 installs and 9 reopens, so 118 installs
iTunes Connect: 56 installs
155 vs 118 vs 56. And I am measuring the same thing.
For group2:
Facebook: 663
Branch: 651
iTunes Connect: 198
663 vs 651 vs 198. Still measuring the same thing.
Wait, wut? Yes, the difference between Facebook and Branch numbers are 1.8%-31.4%, between iTunes and Facebook it is 63.9%-70.1%, and iTunes and Branch it is 52.5%-69.6%. The “variance” of this magnitude is unacceptable.
This is very important, because if I take Facebook’s data for granted than I would get very different ROI for my marketing campaign. If we take into consideration that Facebook recently had a pretty big data reporting scandal on how they falsely measured and reported the metric on videos watched, than I am pretty sceptical if these numbers are correct.
The good thing is that now I know something is off. The bad news is that I still don’t know for sure what the problem is. Is the data in Facebook not OK? Is iTunes Connect the issue? Do they measure things differently? Does the link redirect get broken somehow? I am still trying to wrap my head around the issue, but was unable to crack the egg in the last few weeks. But, at least we are aware of this issue.
Takeaway
“If you want to make data driven decisions, you have to understand the data you are analyzing.”
You need to understand how it was created, captured and processed. It turns out that somewhere along the line something gets broken in this process. If you are aware of the fact that you could run into such data discrepancies during your job, than you are getting closer to do much better work. That is why data literacy matters.
This article was written by Gabor Papp, a Hungarian SEO Expert and Growth Marketer at Shapr3D.