
A few years ago we were running a major homepage A/B test with one of my clients. Huge traffic, huge potential, huge expectations — and huge risk, of course. We did our homework: our new design was well-researched and very promising, so we were all very excited. Especially Phil, the CEO of the company.
We launched the A/B test on the 1st of October and just in a few days the new version performed +20% better than the old one. The statistical significance was climbing slowly up, too: 50%, 60%, 70%… But then on the ~21st of October when I checked the data, our experiment was still not conclusive: +19% in conversion, with 81% significance.
But the client wanted results!
The CEO said to me:
“Okay, Tomi, we’ve been running this test for three weeks now. I know, we are aiming for 99% significance. But look at the numbers. They are so stable! Why are we wasting time by still running it? Do you honestly think that version B won’t beat version A after all?”
To be honest, I also thought that version B would win. But I knew that it doesn’t matter what I think. The only thing that matters is what the numbers tell… 81% statistical significance feels pretty strong but when you rationally think it over, it’s risky. And when you are running experiments continuously, these risks will very quickly add up into a statistical error — and, well, into losing big money.
It’s human nature that we tend to misinterpret (or even ignore) probability, chance, randomness and thus statistical significance in experiments.
But that’s why A/B testing statistics is so important!
In this article, I’ll dig deeper into these concepts, so you can avoid some of the most typical A/B testing mistakes.
Winner by chance
You have to understand one important thing.
The human brain is wired in a way that it tends to underestimate the probability of something very unlikely happening. And it’s true the other way around: when something happens totally randomly, we like to rationalize it and say that it happened for a reason.
This phenomenon might affect your judgement when evaluating A/B test results.
When one of the new variations seems like it’s winning, people like to think that’s because they were so smart and came up with actually better-converting design or copy. And they fully ignore the fact that there is a certain probability (sometimes a very high probability) that their version only seems to be winning due to natural variance.
If you are new to A/B testing, it’s not easy to get a grasp of the effect of randomness. But there is a good way to demonstrate it to yourself. That is: running an A/A test.
What is an A/A test?
An A/A test is basically like an A/B test… only this time you don’t change anything on the B variant. You run two identical versions of your webpage and you measure which version brings in more conversions.
Naturally, you would expect that the conversion rates will be the exact same. After all, you didn’t change anything, right? But most of the time, you’ll see some difference. Sometimes, these differences will be quite big. Is something wrong with your A/B testing software? Probably not. (At least, I can speak for Google Optimize or Optimizely. But I have to admit there is some other, less trustworthy A/B testing software out there, too.) The thing you’ll see is the normal fluctuation of conversion rates. Chance in action.
Introducing: the p-value
To make sure that you wouldn’t evaluate an experiment based on random results, statisticians implemented a concept called statistical significance — which is calculated by using something called p-value.
P-value is created to show you the exact probability that the outcome of your A/B test is a result of chance.
And based on that, statistical significance will show you the exact probability that you can repeat the result of your A/B test after publishing it to your whole audience, too.
So they are pretty useful things. But people like Phil — the CEO from my opening story — tend to ignore them. Either because they don’t understand the concept itself or the importance of them.
Either way: let’s change that and see what statistical significance and p-value are at their core.
What is statistical significance?
Here’s an A/B test with an extremely small sample size. I’ll use it to explain the concept, then we will scale it up to a test with ~20,000 participants.
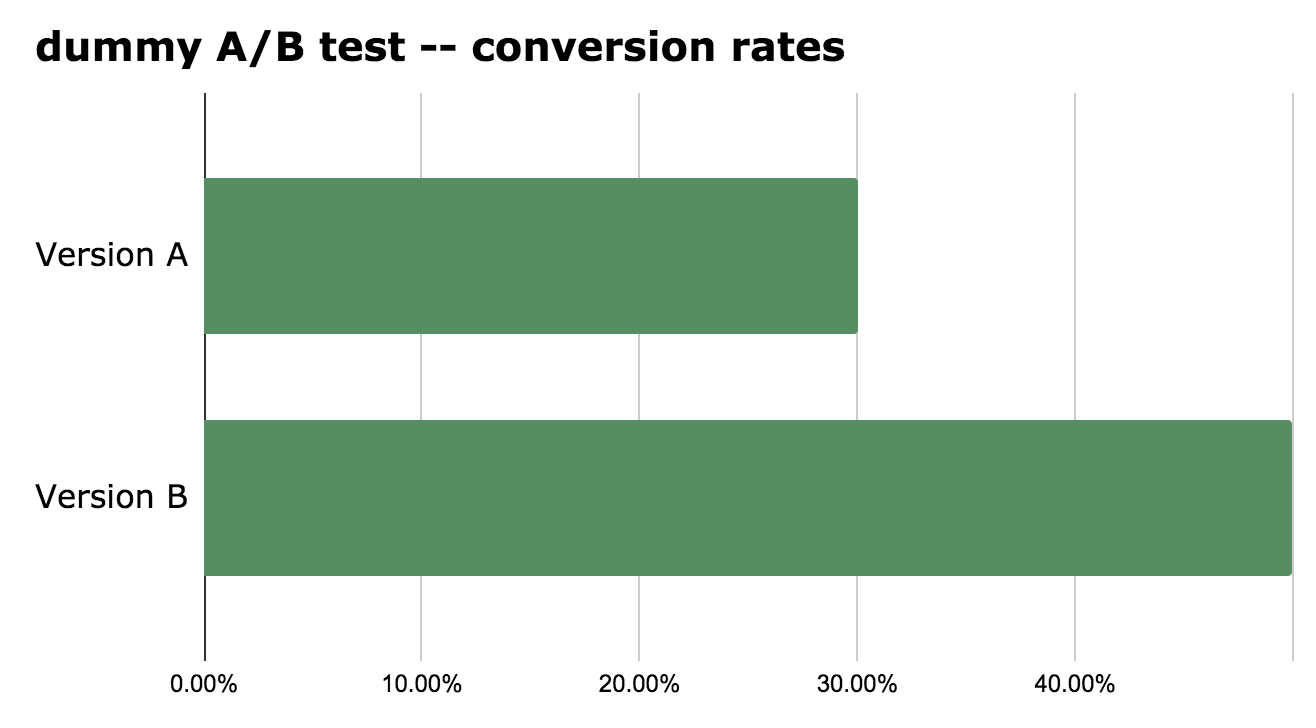
- Version A: 10 users – 3 conversions – 30% conversion rate
- Version B: 10 users – 5 conversions – 50% conversion rate
Version A’s conversion rate is 30%. Version B’s is 50%. That’s +66.6% for version B. We see that the sample size is very small, so the 66.6% uplift doesn’t really mean anything – it happened most probably by chance.
But “most probably by chance” is not a very accurate mathematical expression. We want a proper percentage value so we can see the exact probability that this result could have happened by chance.
Let me repeat this one more time because it’s not an easy sentence but it’s important:
We want to see the exact probability that this result could have happened by chance.
If this value is low (<1%) than we can tell that version B is indeed better than version A.
If this value is high (>10%) than our result could have happened randomly.
Thanks to mathematics, it’s not too hard to calculate it.
Note: By the way, you won’t ever have to run statistical significance calculations for real… it’s done for you by most A/B testing software. But I want you to see what’s happening under the hood, so you’ll know what that 99% (or 95%, 90%, 71%, etc.) value really means.
Calculating statistical significance
Note: There will be a few mathematical and statistical concepts in this section. Even if you hate numbers, stay with me for two reasons:
- I’ll explain everything so that even the most anti-number person will understand it easily.
- Understanding this will change your view on A/B testing for your entire career — in a good way.
Let’s go through these steps:
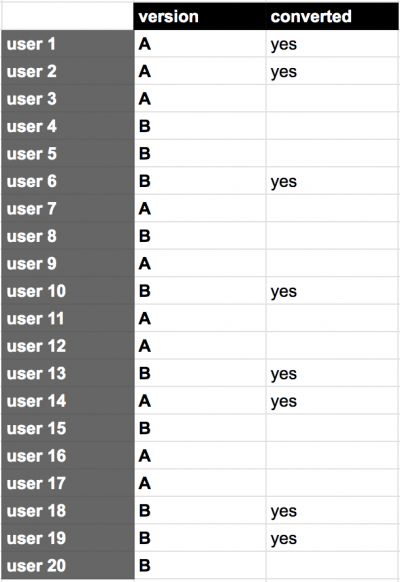
STEP 1) Take the list of the users who participated in our example experiment and see who has converted and who hasn’t.
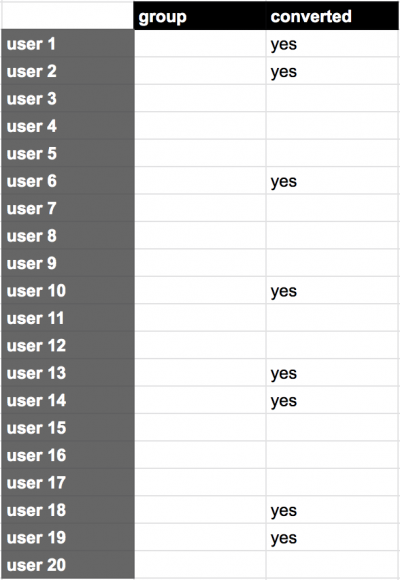
STEP 2) This is the tricky part: for our probability calculation, let’s forget a bit that this is an A/B test at all, and remove the group information from our table.
STEP 3) Then we will simulate chance. (Sounds cool, right?)
The way we do that is that we take the 10 “A” and the 10 “B” values that we removed in the previous step and we re-assign them randomly to our users.
This is a key step: when we randomly assign A and B values, there is a chance that something extreme occurs. (E.g. all conversions happened with A users.) If we do this – say – 5000 times, we will see a proper distribution of the extreme and less extreme cases.
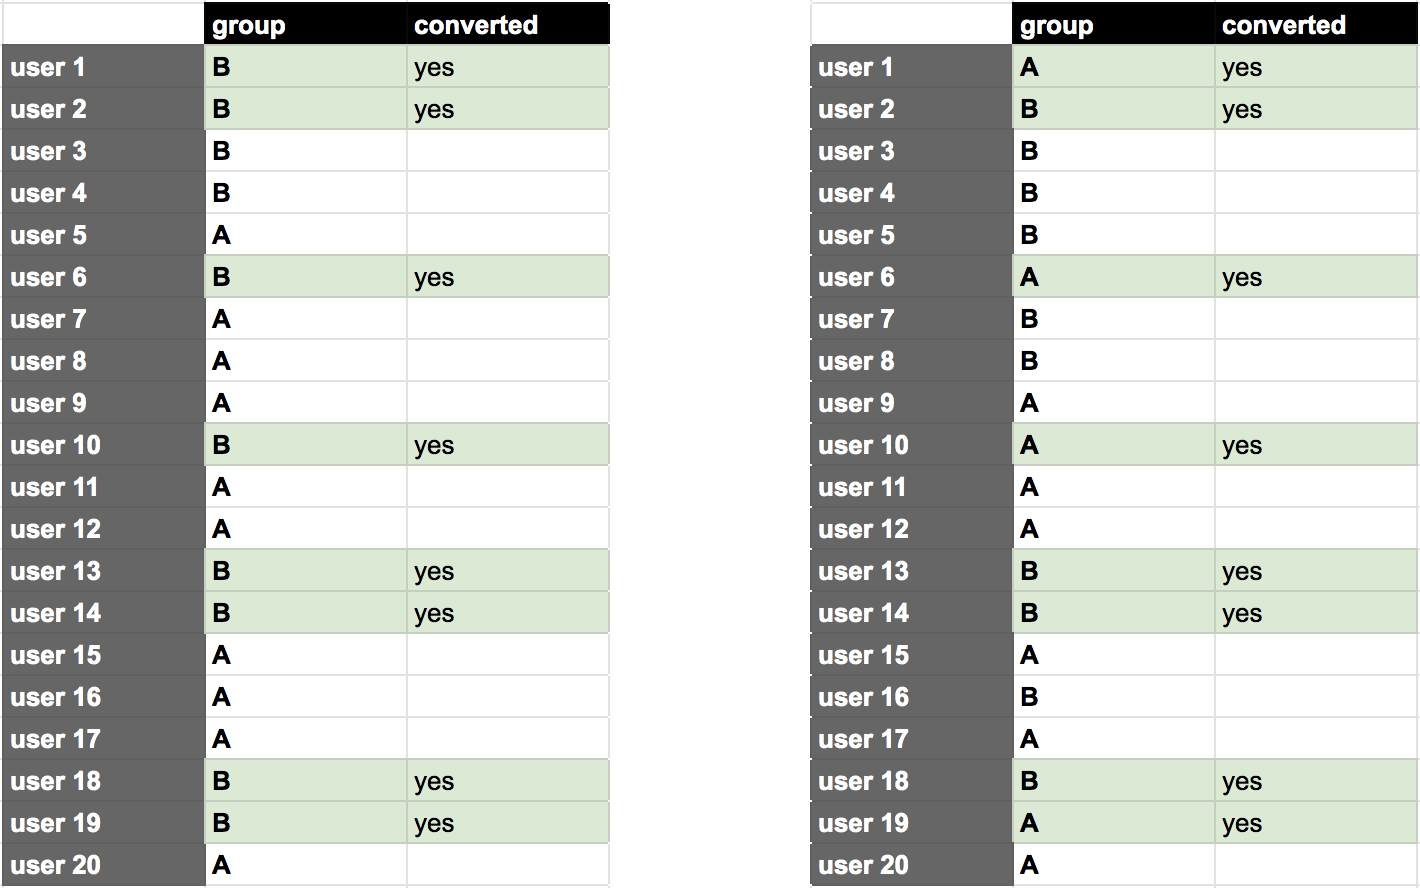
LEFT: an extreme case (all conversions happened with B users) — RIGHT: not-so-extreme case (4 conversions happened with A users and 4 with B users)
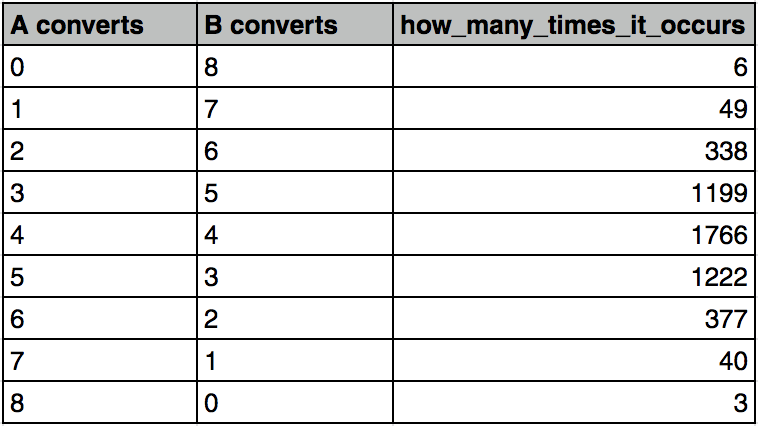
STEP 4) Repeat STEP 3) 5000 times, and get the distribution of the different outcomes.
On a chart:
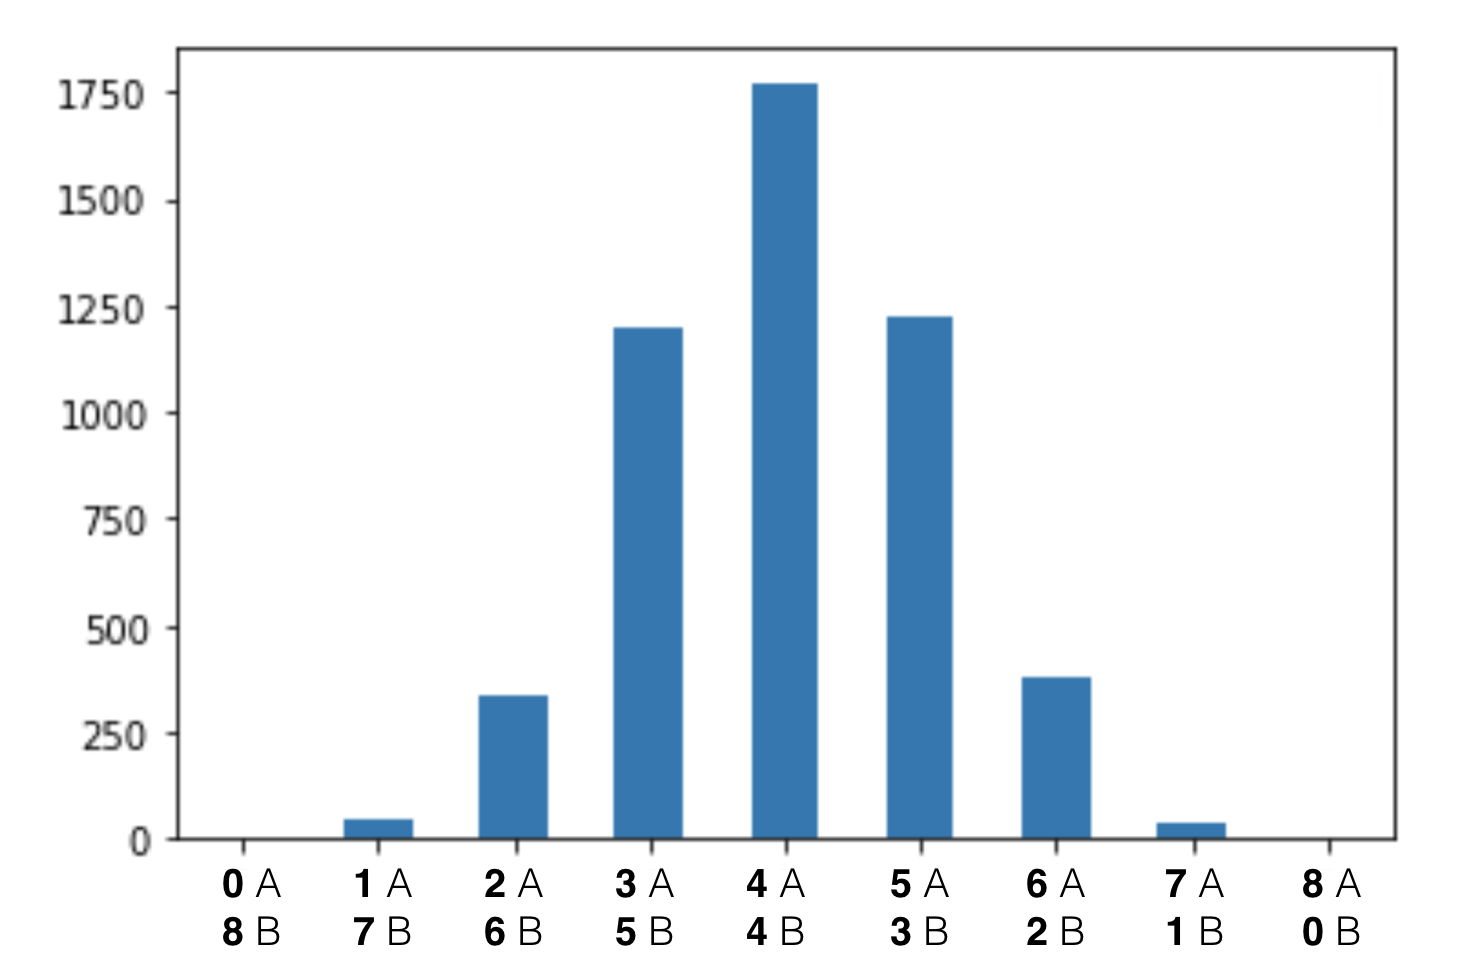
Note: in an ideal world, we would simulate all possible scenarios for assigning A and B, so we could see a 100% accurate distribution of all cases. But that would be 20! = 2,432,902,008,176,640,000 different scenarios even on this small sample. That’s too much for a powerful computer, too.
As you can see, we have a few extreme cases (all conversions happened with A users) and many more not-so-extreme cases (e.g. 4 conversions happened with A users and 4 with B users).
Again: we do this to simulate the possible scenarios that can occur in our dataset. More precisely, to see how frequently each of these scenarios come up.
If we see that our original case (3 conversions in group A and 5 conversions in group B) occurs very often (even when A and B values are assigned randomly) then we can conclude that our +66.6% conversion uplift is very likely only the result of natural variance. In other words, it is not statistically significant.
If we see that our original case occurs very rarely, then we can say that it’s very unlikely that it happened by chance. So it is statistically significant.
In our specific case our results seem not to be statistically significant.
Note: The method I described here is called the permutation test. If you want to understand it better, then here’s the best visual explanation I’ve seen about it so far: Permutation Test.
What is a p-value?*
Did you realize?
We still don’t have an exact percentage value. But we are pretty close to that.
Now that you understand the concept, let’s finish this by running the actual calculations.
Here’s the chart again. It shows the distribution of the 5,000 different scenarios from our simulation above.
The calculation goes:
We take all the scenarios where B converts at least 66.6% better than A.
So all these:
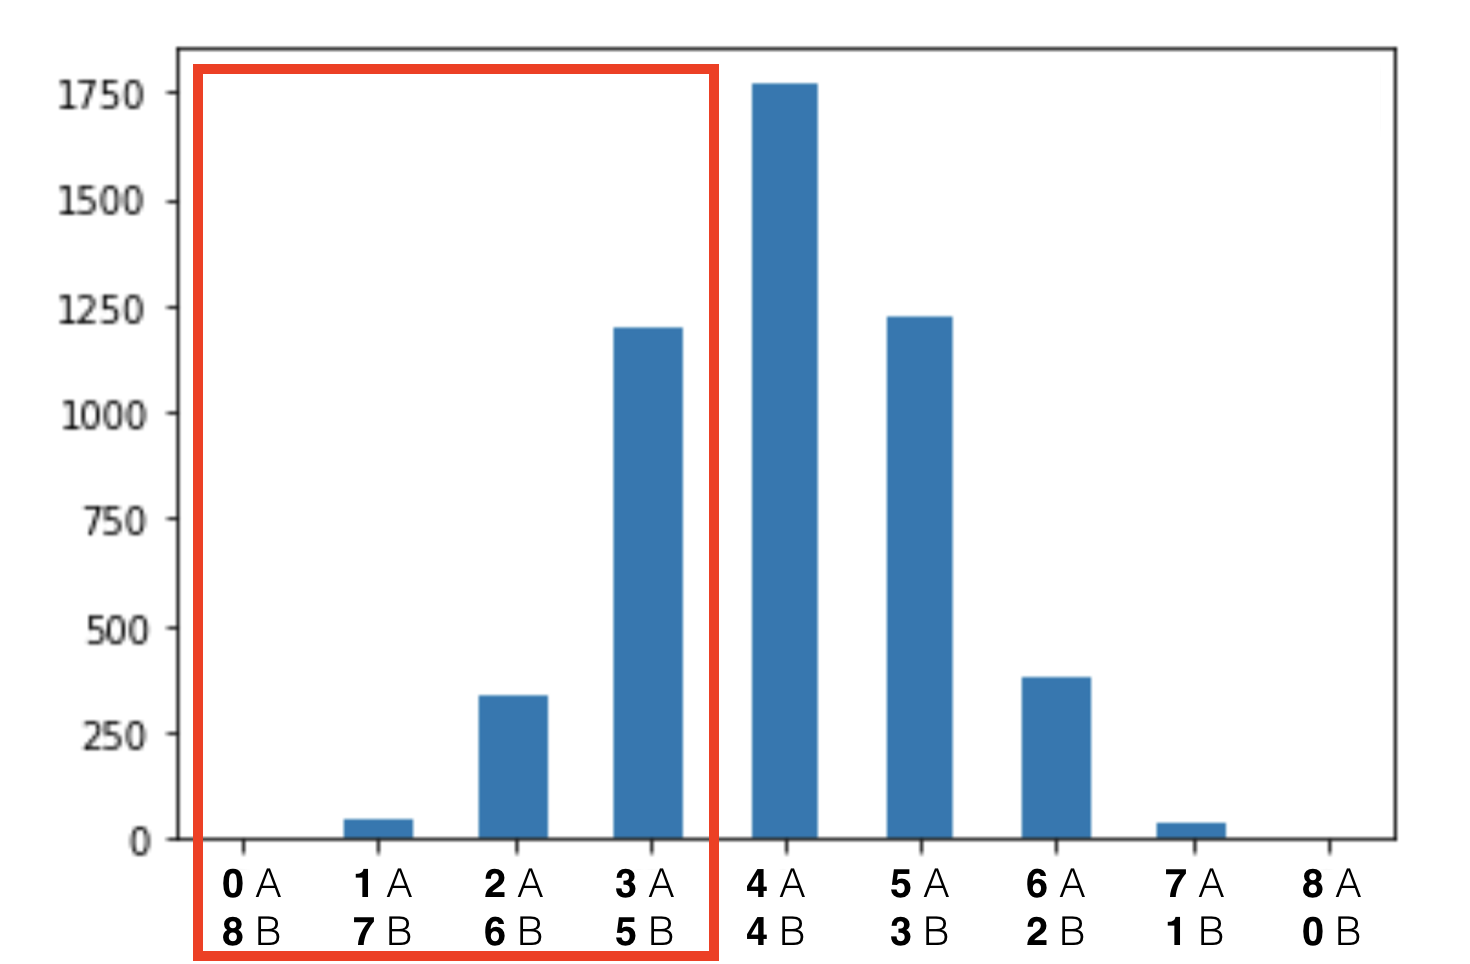
We can find the exact number of these scenarios in our distribution table.
Add them up! And divide them by 5,000 (which is all cases).
The result is: 1592 / 5000 = 0.3184
31.84%. That’s the probability that – by natural variance – something as or more extreme occurs as occurred in our experiment. This is called the p-value. The statistical significance is calculated as simple as 1 – p, so in this case: 68.16%.
Hmm… 68.16%.
Is it high? Is it low? Very important question.
I’ll get back to that soon.
But first, let’s quickly redo this whole process with a bigger sample size.
Calculating statistical significance and the p-value with 20.000 users
Let’s take another A/B test example:
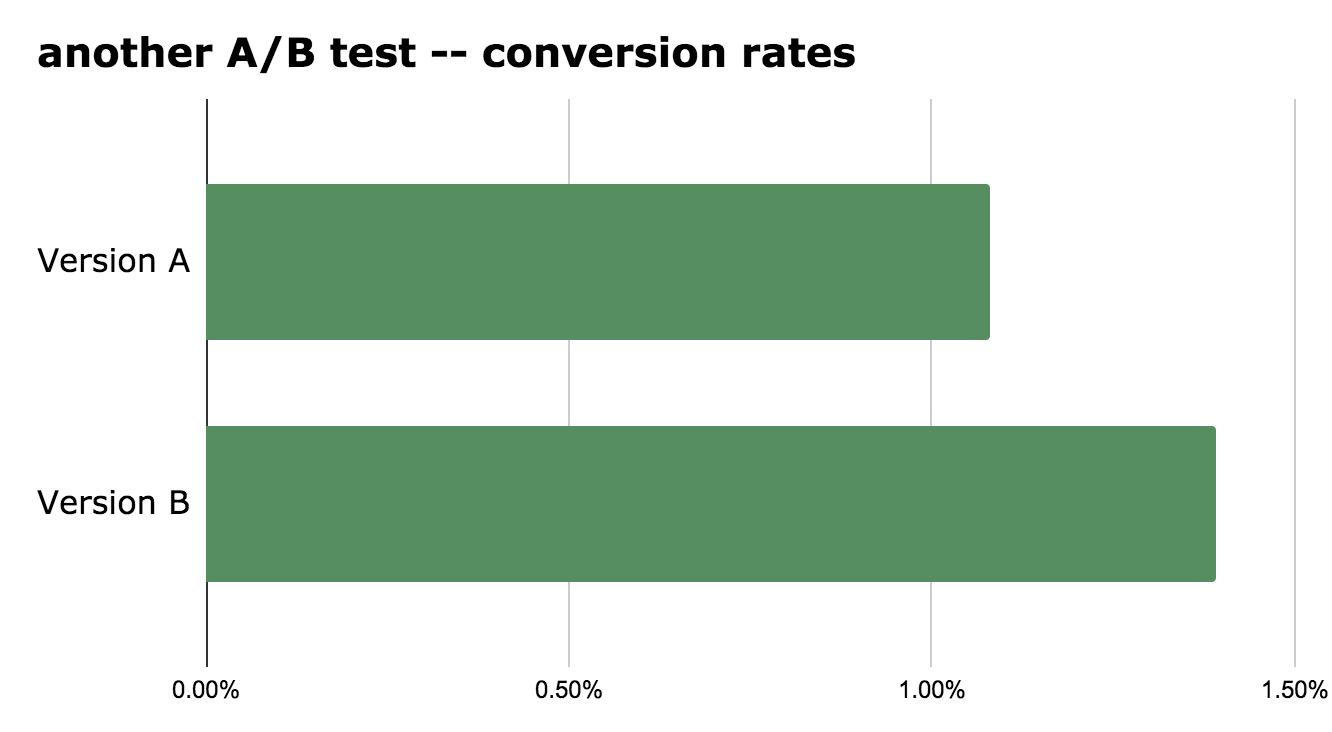
- version A: 10,000 users – 108 conversions – 1.08% conversion rate
- version B: 10,000 users – 139 conversions – 1.39% conversion rate
That’s a +28.7% increase in conversion rate for variation B. Pretty decent.
Let’s figure out whether it’s statistically significant or not!
To get our p-value, I’ll run the same steps as before:
- Get all user data into one table.
- “Shuffle” the A and B values randomly between users.
- Repeat that 5,000 times
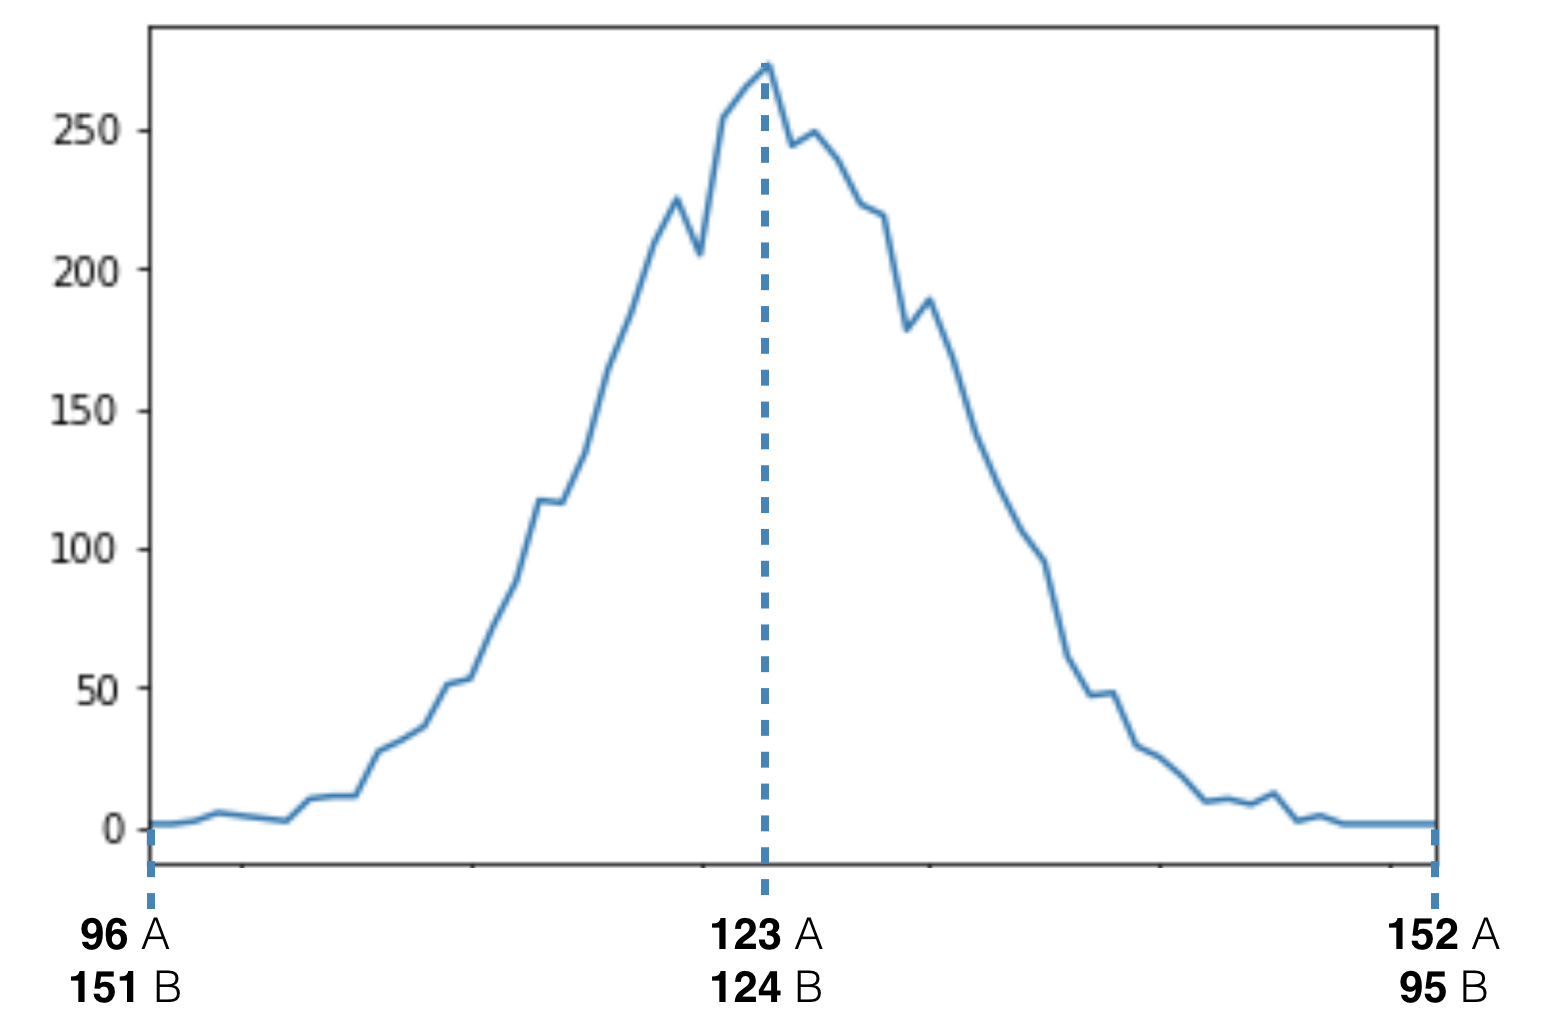
- Get a distribution chart.
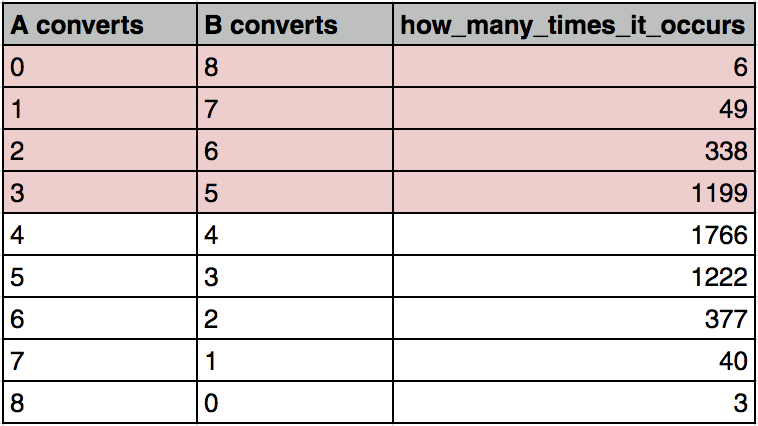
The result is this:
To get our p-value we will have to count every case where the conversion rate was as high or higher than 1.39% for version B.
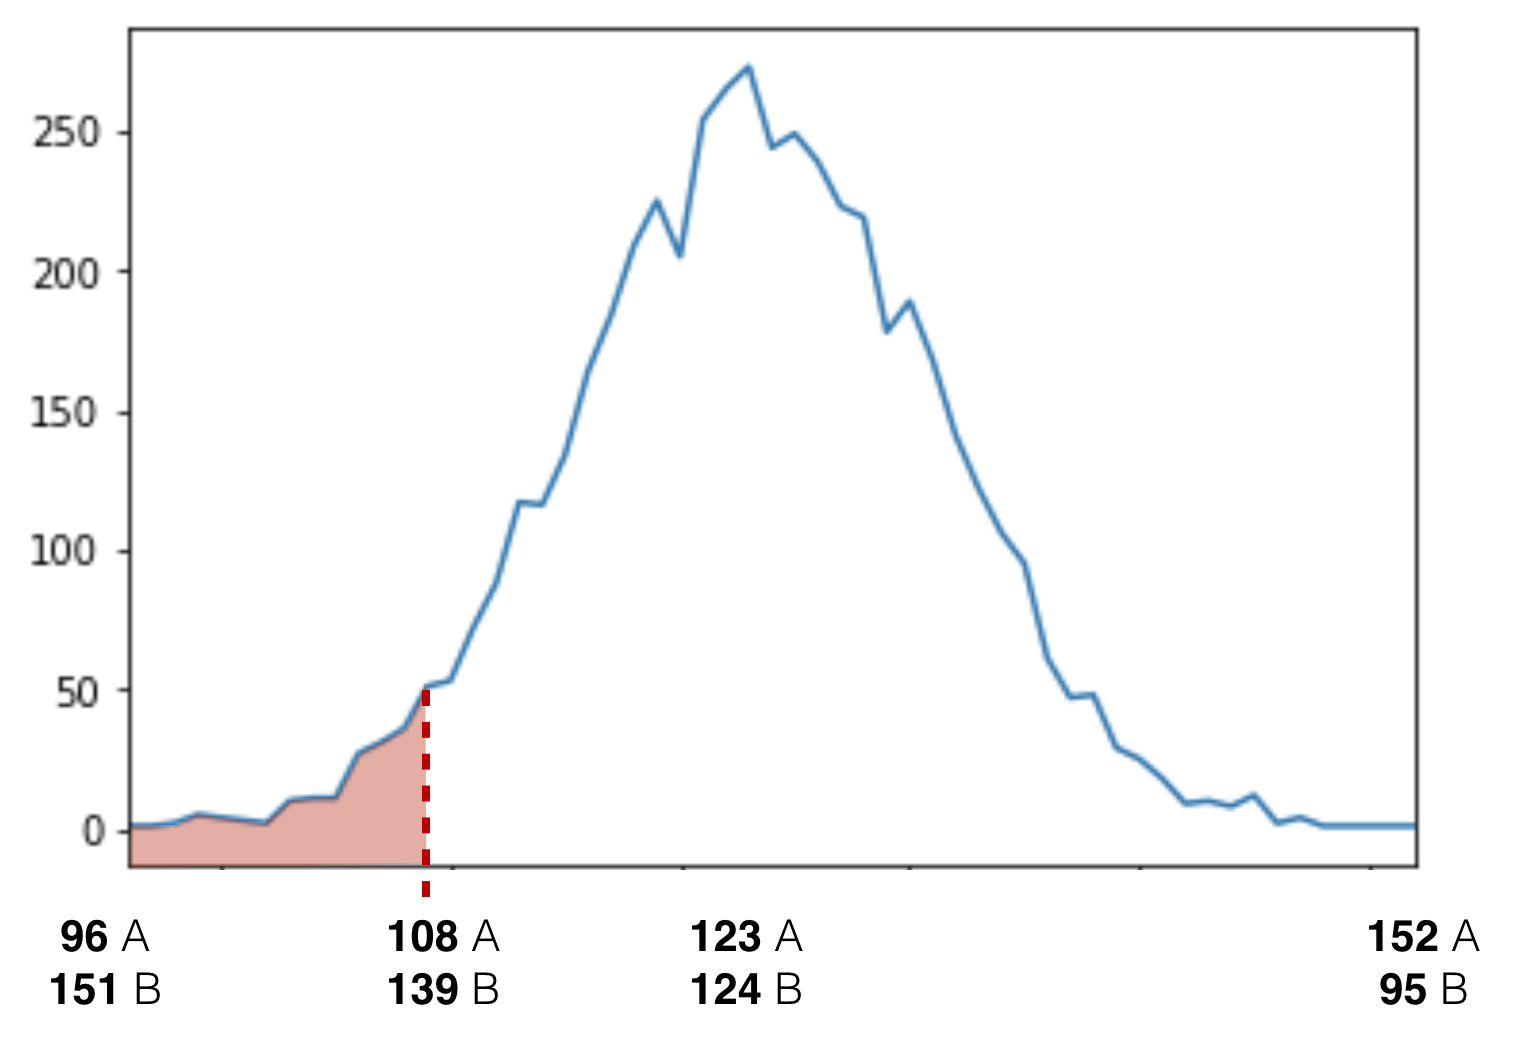
I won’t add the distribution table here because it’s way too big. But similarly to before, I’ll add up the numbers in it.
It’s 121 cases in total. So our p-value is 121/5000 which is: 0.0242.
This means that our statistical significance is 1 – 0.0242 = 97.58%.
Nice!
But the question is again: 97.58%… Is it high? Is it low?
Let’s see!
What does an 80% significance rate really mean? Why do we shoot for 95% or 99%?
As I mentioned, probability is not a very intuitive thing. Even if we have an exact percentage value, the human brain tends to think in extremes.
For example, 80% probability sounds very strong, right?
If you go to the casino, anything with 80% probability sounds like really good odds. Something that you’d happily put your money on.
But an online business is not a casino — and A/B testing is not gambling.
In an online experiment, 80% statistical significance is simply not enough.
Let me tell you why.
False positives and false negatives
Have you ever found an important email in your spam folder? We all do. That’s called a false positive. Your spam filter detected an email as spam when it wasn’t. Spam filters work with a 0.1% false-positive-rate, which sounds very solid. Still, every once in a while they make mistakes.
And false positives play an important role in A/B testing, as well.
Let’s say you run an experiment and you see that your version B brings 41.6% more conversions than your version A. You are happy. Your manager is happy! So you stop the experiment and publish version B… And then you see over the next 3 months that your conversion rate doesn’t get better: in fact, it drops by 22.3%. Your test result was a false positive!
Similarly to your email (that was labeled as spam but wasn’t spam), your B version was labeled as the winning version but it wasn’t the winning version. From a business perspective, this is a disaster, right? It’d have been literally better not to A/B test at all.
And similar things happen all the time in real businesses.
So how do you lower the risk?
How do you avoid false positives?
It’s simple. Be very strict about your statistical significance!
When you decide to stop your experiments at 80% significance and publish the winning versions, statistically speaking, you’ll have 1 false positive out of 5 tests.
When you go for 95%, this number decreases to 1 out of 20.
At 99% it’s 1 out of 100!
It’s as simple as that.
I mean, the willingness to take risks differs by person. The ideal significance rate is not set in stone and you’ll have to decide for yourself what is right for you. But as you can see, there is a huge difference between 80%, 95% and 99%.
I personally always push for 99%+.
And it’s super easy, too. You don’t have to do anything but wait and gather more data. I know that some say that “speed is key for online businesses…” But for me, running a test for 2 more weeks – as opposed to getting fake results – really feels like the lesser of the two evils.
Conclusion
This article helped you to understand some crucial A/B testing statistics concepts:
- what statistical significance really is,
- why is it so important and
- how it’s calculated.
At the end of the day, in A/B testing, there is no 100% certainty — but you should do your best to lower your risk. With that, you’ll be able to use your experiments to best purpose: learning about your audience, getting better results and achieving real, long-term success.
- If you want to learn more about how to become a data scientist, take my 50-minute video course: How to Become a Data Scientist. (It’s free!)
- Also check out my 6-week online course: The Junior Data Scientist’s First Month video course.
Cheers,
Tomi Mester
Cheers,
Tomi
* Disclaimer: A critique of the p-value
I have to admit one thing. In this article, I simplified a bit the real meaning of the terms “statistical significance” and “p-value”. I did this to make the concepts easier to understand. And I honestly think that the way I defined them is the most practical and useful for most online marketers and data scientists. But – for scientific accuracy – I wanted to add here a short related quote from the Practical Statistics for Data Scientists book (by Andrew Bruce and Peter C. Bruce):
“The real problem is that people want more meaning from the p-value than it contains. Here’s what we would like the p-value to convey:
The probability that the result is due to chance.
We hope for a low value, so we can conclude that we’ve proved something. This is how many journal editors were interpreting the p-value. But here’s what the p-value actually represents:
The probability that, given a chance model, results as extreme as the observed results could occur.
The difference is subtle, but real. A significant p-value does not carry you quite as far along the road to “proof” as it seems to promise. The logical foundation for the conclusion “statistically significant” is somewhat weaker when the real meaning of the p-value is understood.”
Later the author says:
“The work that data scientists do is typically not destined for publication in scientific journals, so the debate over the value of a p-value is somewhat academic. For a data scientist, a p-value is a useful metric in situations where you want to know whether a model result that appears interesting and useful is within the range of normal chance variability.”
If you want to dig deeper into A/B testing statistics (or just in general: into statistics), check out the book. It’s a very good one for aspiring and junior data scientists.
Further reads (sources, inspiration and references)