
Margin of error is one of the most important statistical concepts to know when you look at the results of online surveys or polls. If you don’t know it, you can easily misinterpret the results and make false conclusions. On the other hand, if you know it, you can be more confident how to use your results. Today I’ll explain this important concept for you!
Margin of error: a practical example
Let’s start with a story!
The HR Department of a company runs the same survey every year.
The company has 3000 employees and HR receives 550 responses both in 2021 and 2022 (for simplicity).
In the survey, there is a question about salary satisfaction and the results are:
2021: 85% are satisfied with the salary.
2022: 89% are satisfied with the salary.
When the HR Manager presents the results, she states that salary satisfaction clearly increased.
But, she is not necessarily true.
Why?
The HR manager forgot to mention the Margin of Error.
- What is the Margin of error?
- How to calculate it?
- When and how to use it?
You will get the answers in this blog post – and you’ll see how the HR manager could have done better. Let’s dig in!
What is the Margin of error?
The Margin of Error (MoE) is a statistical concept that helps to measure the uncertainty of a survey or poll result. It is typically expressed as a percentage or number.
Surveys and polls are usually based on samples, which are smaller groups selected from the larger population. Since the sample is not the entire population, there is some uncertainty or variability in the results. If the margin of error is large, it may indicate that the sample was not representative of the population. On the other hand, if the margin of error is small, it indicates that the sample estimate is reliable, and we can be more confident in its accuracy.
From the Margin of Error, we can calculate the confidence interval
The margin of error gives us the confidence interval. It indicates the range within which the true population value likely lies. The width of the range will be two times the margin of error. It has two boundaries:
- Lower bound = observed score – MoE
- Upper bound = observed score + MoE
Note: remember “MoE” stands for Margin of Error.
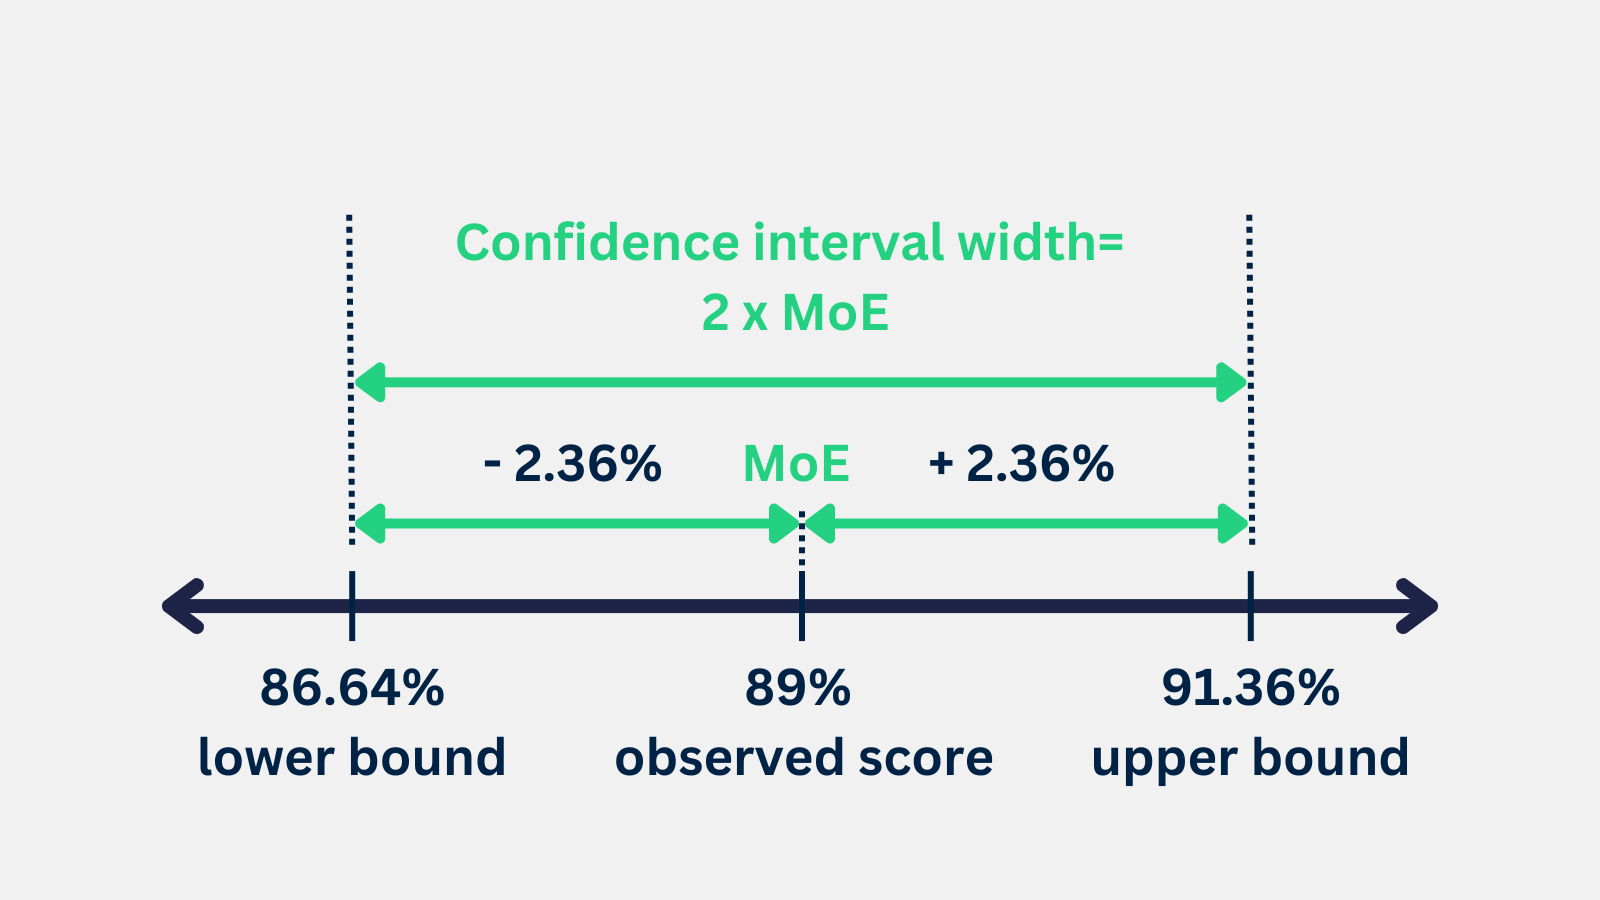
Note: These are the values for our original example, so if you are a good observant you probably already have an idea why the HR Manager was mistaken.
There are several factors that affect the margin of error.
The most important of these is the sample size. In general, the larger the sample size, the smaller the margin of error will be. This is because a larger sample provides more information about the population, and therefore it is more likely to produce an accurate estimate.
Confidence level
There is a big difference between confidence interval and confidence level.
Did you notice the word ‘likely’ in the definition of the confidence interval?
When we are working with samples, we cannot be entirely sure that the sample is a perfect representation of the population, hence we cannot be certain that the confidence interval is correct all the time. We can describe this uncertainty (or certainty) with probabilities.
The confidence level tells you how confident you can be that the confidence interval is correct and it will include the true score for the population.
In business, the standard confidence interval is 95%, while for some medical or scientific studies, 99% is usually used, but it can be any value between 0 and 100.
For example, a 95% confidence level means that 95% of the time, the corresponding confidence interval will include the true score.
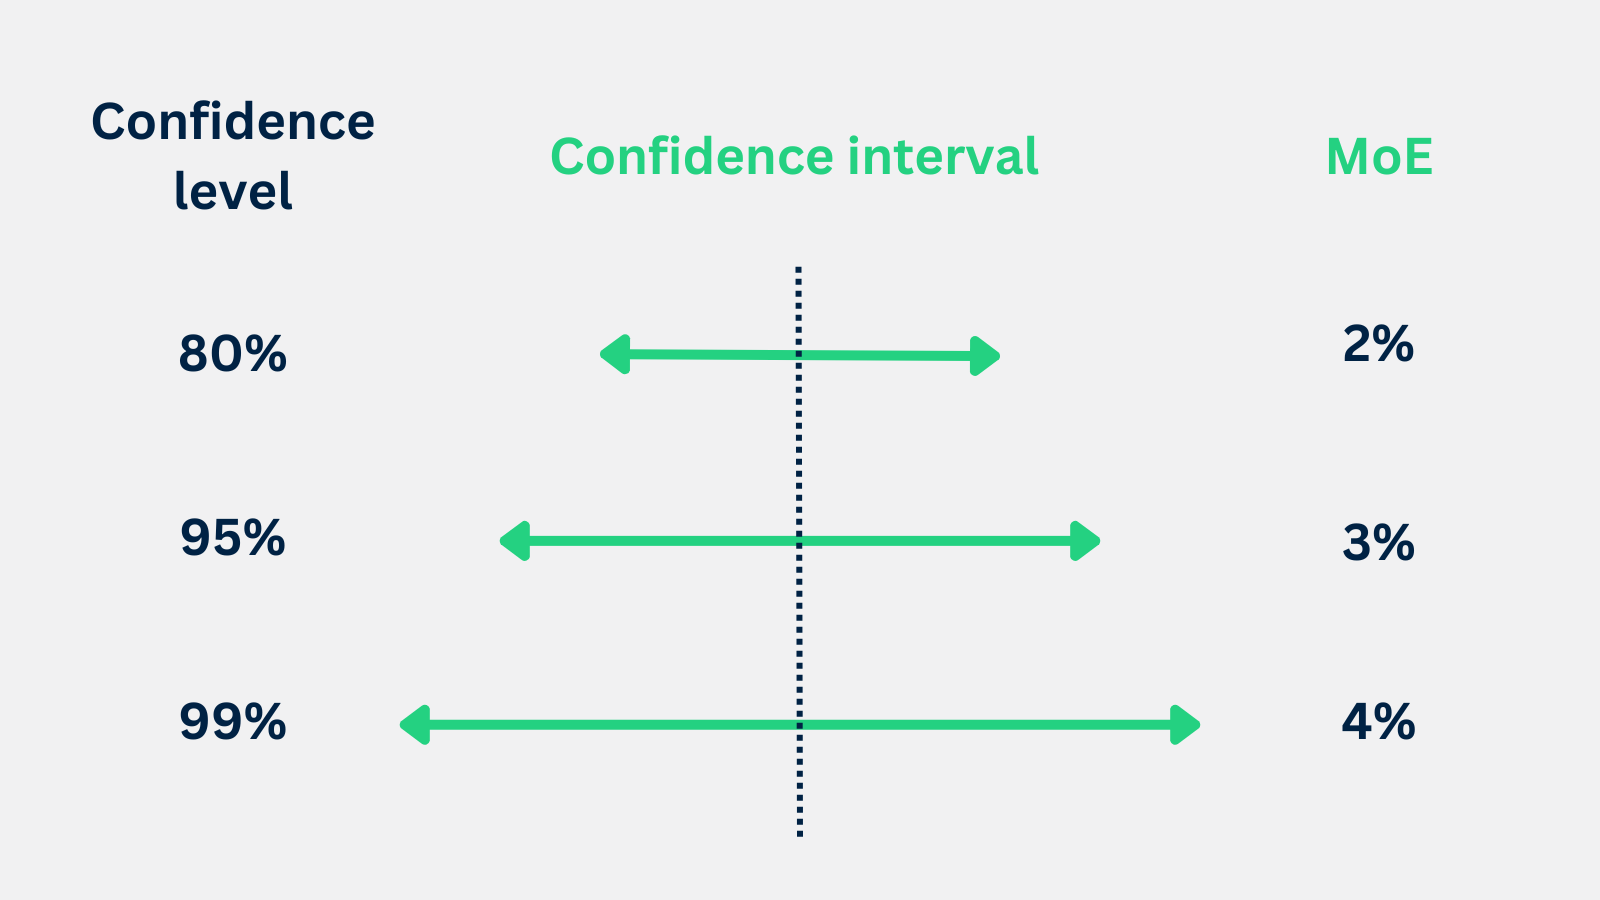
You may ask: Why don’t we use 99% all the time? We want to be sure that our calculation is correct.
There is a logical answer to this question. The higher the confidence level, the larger the margin of error will be. If you want to be sure that the true score is in the confidence interval, you need to increase the confidence interval. MoE with a 95% confidence level will be larger than if we want to be 90% confident in the accuracy of the estimate.
Z-score
The z-score is a statistical measure that represents the number of standard deviations a value is from the mean of a data set.
To compute the z-score we need to have information on the mean and standard deviation of the complete population. When we have no information on these (just like in our example), we can assume a normal distribution and use the standard z-scores for calculations.

In the normal distribution, according to the 68-95-99.7 rule, we would expect that 95% of the results are within +- 1.96 standard deviations of the true mean. This interval is the confidence interval at a 95% confidence level.
The z-table lists the z-scores for each standard deviation from the mean, and you can use it to look up the z-score for a given confidence level. For example, the z-score for the 95% confidence level is 1.96.
Here are the most used z-scores:
| Confidence Level | Z-Score |
| 80% | 1.28 |
| 90% | 1.64 |
| 95% | 1.96 |
| 99% | 2.58 |
| 99.9% | 3.29 |
Margin of Error Formulas — it’s time to calculate MoE!
We have different formulas for different scenarios.
- When we calculate with numbers
- When we calculate with proportions
- When we have a small population size
The general formula assumes an infinite or very large population with normal distribution in the first 2 cases, the only difference there is if we use numbers or proportions.
Sometimes we need to work with smaller populations and sample sizes, just like in our original HR example. In these cases, we need to adjust our calculations with the sample size, relative to the population.
Margin of Error formula #1
Let’s see an example for case #1:
You are conducting a survey to determine the average height of adult men in the United States. You collect data from a random sample of 500 men and find that the average height is 68 inches with a standard deviation of 3 inches. What is the margin of error for the survey results at a 95% confidence level?
In this example, we need to use this formula:
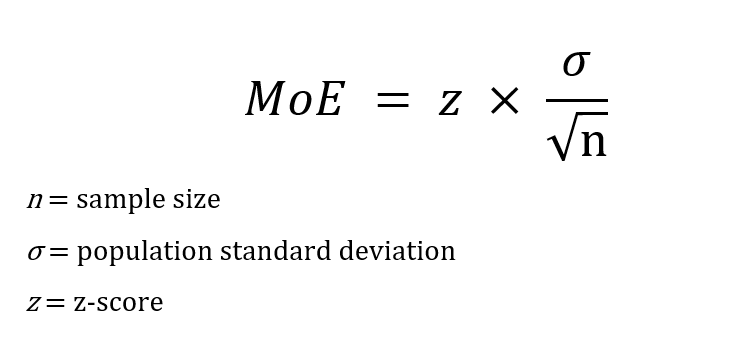
The z-score for a 95% confidence level is 1.96, the standard deviation is 3 inches, and the sample size is 500 men. Plugging these values into the formula, we get: 0.34
This means that we can be 95% confident that the true average height of adult men in the United States is between 67.66 inches (68 – 0.34) and 68.34 inches (68 + 0.34).
Margin of Error formula #2
Here is another example for case #2, with proportions:
You run a survey to determine the proportion of people who prefer dogs over cats. You collect data from a random sample of 1000 people and find that 600 of them prefer dogs, while 400 prefer cats. What is the margin of error for the survey results at a 90% confidence level?
To solve this we need another formula:

In this formula, sample proportion means the proportion who chose a particular option. In this case, the proportion of people who like dogs is 600/1000 = 0.6
The z-score for a 90% confidence level is 1.645, the proportion of people who prefer dogs is 0.6 (600 out of 1000), and the sample size is 1000 people. Plugging these values into the formula, we get: 0.008
This means that we can be 90% confident that the true proportion of people who prefer dogs over cats is between 0.592 (0.6 – 0.008) and 0.608 (0.6 + 0.008). So 59.2% and 60.8%
Margin of Error formula #3
And case #3 (small population):
Now let’s see our original HR survey example, where we have a relatively small population (3,000 employees) so we need to adjust the formula a little bit.

The z-score for a 95% confidence level is 1.96, the proportion of people who were satisfied with their job is 0.85, the sample size is 550 people, and the population is 3000. Plugging these values into the formula, we get 0.02697 so 2.7%
This means that the true value for the population in 2021 is between 85+-2.7% so 82.3% – 87.7%
Using the same formula for the second survey in 2022, we get a 2.36% MoE. The real population satisfaction is between 89 +- 2.36%, so 86.64% – 91.36%
As you can see from the results it can be the case that salary satisfaction decreased, if it was 87.7% in 2021 and 86.64% in 2022.
Conclusion
It is important to use Margin of Error (MoE) when interpreting the results of surveys or polls, as it gives an indication of how reliable the sample estimate is. Without this information, it is easy to misinterpret the results.
Besides the clear communication and understanding of results, the MoE can help in decision-making by providing an idea of how accurate the sample estimate is and it tells the level of uncertainty. It also allows us to compare the results of different surveys or polls.
Sample size has the biggest impact on MoE. A larger sample size provides more information about the population and is therefore more likely to produce an accurate estimate.
You can also affect the outcome if you adjust the confidence level. As we discussed increasing (decreasing) the confidence level will increase (decrease) the MoE and hence the confidence interval.
Don’t be like the HR manager, and always communicate the uncertainty of your results!
- If you want to learn more about how to become a data scientist, take Tomi Mester’s 50-minute video course: How to Become a Data Scientist. (It’s free!)
- Also check out the 6-week online course: The Junior Data Scientist’s First Month video course.
Cheers,
Levi Kulcsar
Resources:
- https://www.nngroup.com/articles/confidence-interval/
- https://online.stat.psu.edu/stat415/lesson/6/6.3
- https://online.stat.psu.edu/stat100/lesson/9/9.1
- https://en.wikipedia.org/wiki/Margin_of_error
- youtube.com/watch?v=nilZF1KmCg4
- https://www.statisticshowto.com/probability-and-statistics/hypothesis-testing/margin-of-error/