
Google Analytics is the most popular digital analytics tool in the world. Based on W3Techs market share report, Google Analytics is used by 84.1% of all websites for which the traffic analysis tool is known. This is 53.6% of all websites in the world.
But does this mean GA (short for Google Analytics) is the best analytics tool? Of course not. Regardless, if you are working with data, you can’t ignore it. And if you work with experienced digital marketers, most probably, Analytics is the tool that they know. In my presentations and workshops, I refer to GA as a “commercial big data analytics” software. If somebody wants to take a step closer to data science, Google’s tool can be the gateway drug. 🙂
 Today’s guest blogger is Aron Bay. He’s a digital analytics professional and the founder of the PPC Pro digital marketing community. He’s also the co-founder of ExactMatch — an agency which focuses on PPC and analytics projects worldwide.
The brief history of Google Analytics
Before we jump into the reports, I will tell you the brief history of Google Analytics. I think it will help to understand how it got to be the global market leader.
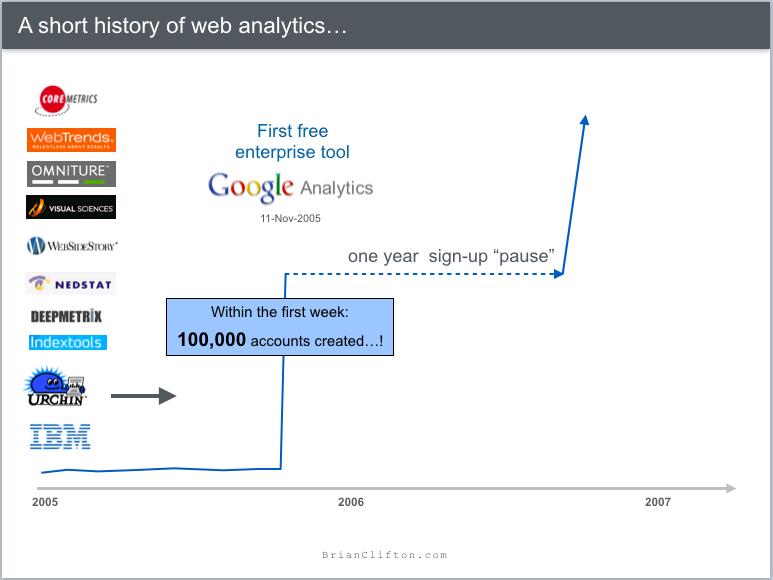
Google Analytics launched on 14th November 2005, after Google acquired the company that developed the software of the same name, Urchin.
It was a special moment in the analytics industry because Urchin was an enterprise-level tool and Google released this product for free. Of course, competitors were not as happy as the users. After one week of launch, more than 100,000 new GA accounts were created in the system. If you think this isn’t so big in the SaaS world, don’t forget that it was 15 years ago. This number is 4-times bigger than the size of the entire analytics industry in 2005.
Google doesn’t provide exact data about how many websites are using Analytics, but based on different sources, in 2015, more than 30 million websites used the tool. In 2020, it is approximately around 50 million if we count in Google app analytics software Firebase (which they acquired too in 2014). For comparison, Facebook Analytics has implemented around 2 million websites in 2019.
Last year Google introduced a new way of measuring. This is (like every new Google product) still in beta and it will be for 1.5-2 years but I think truly it could become Google Analytics 2.0: App + Web.
This new way of measurement will unify app and web analytics, combining the data streams in one Google Analytics property. This means unified reporting, deeper analysis and of course a lot of new features.
But this is the future. Today, I will show you the 7 most important reports in Google Analytics which you should use (at least) on a weekly basis.
#1 Real-time reports
One of my favourites. This is a little bit out of spec. It is not just a report but a group of reports. After you log into your account you will find it at the top of the report groups.
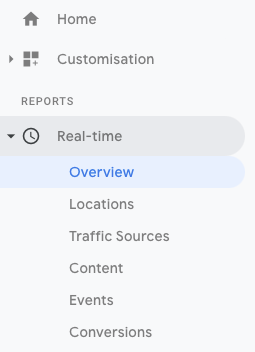
In the overview menu, you can find the most important reports, but if you need some specific information real time, like Traffic Sources, Events or Conversions, you can check that.
The real-time reports feature is also the best way to verify your GA setup. If you just implemented the basic tracking code, set up a new UTM parameter or started tracking a new event: with this report you can immediately monitor the results.
The only feature I miss in real-time reports is e-commerce transactions, but hopefully, at some point, Google will give us this too.
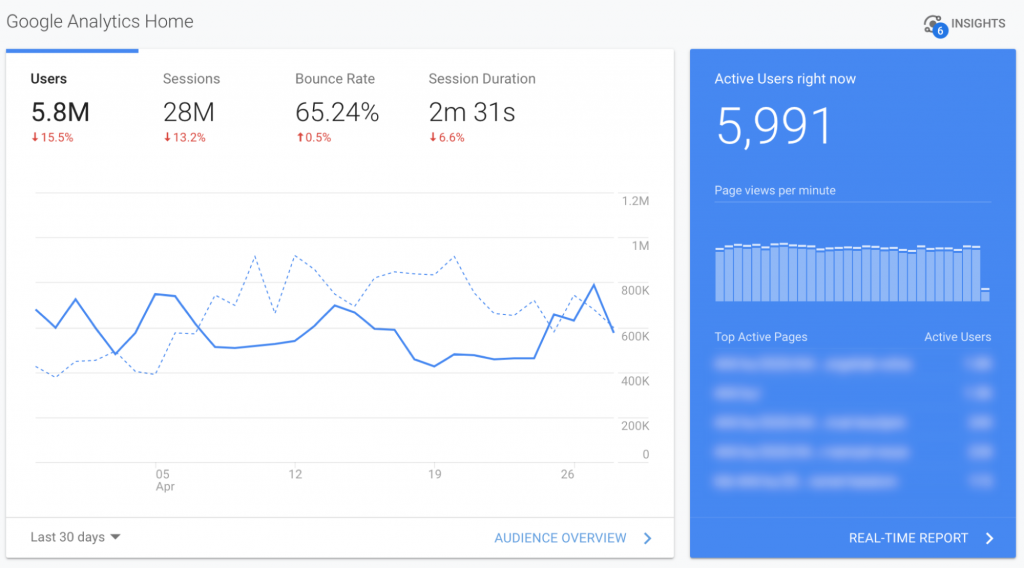
On your GA account’s Home screen, you can see the Active Users in real-time, too:
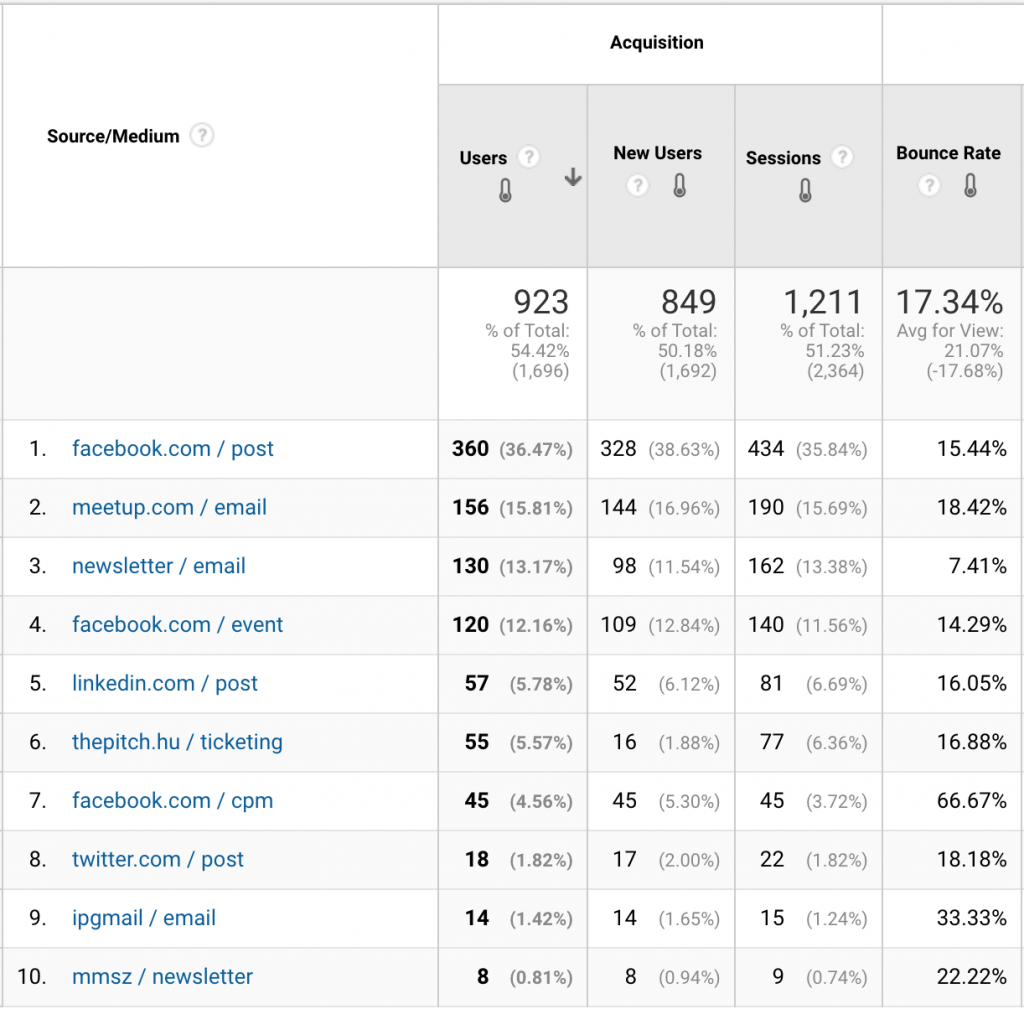
#2 Source / Medium
The Source / Medium report is the holy grail of every digital marketer and data analyst who wants to understand where their website traffic comes from.
I like to think of data scientists as modern Sherlock Holmeses, and this is the place we start to pick up the trail.
But of course, this report can mislead us… at least, if you don’t use UTM parameters.
Note: The name comes from GA’s predecessor Urchin. They invented this feature: Urchin Tracking Module.
If we use a naming convention and a useful logic for these parameters then we can have a much better view of how our sources perform.
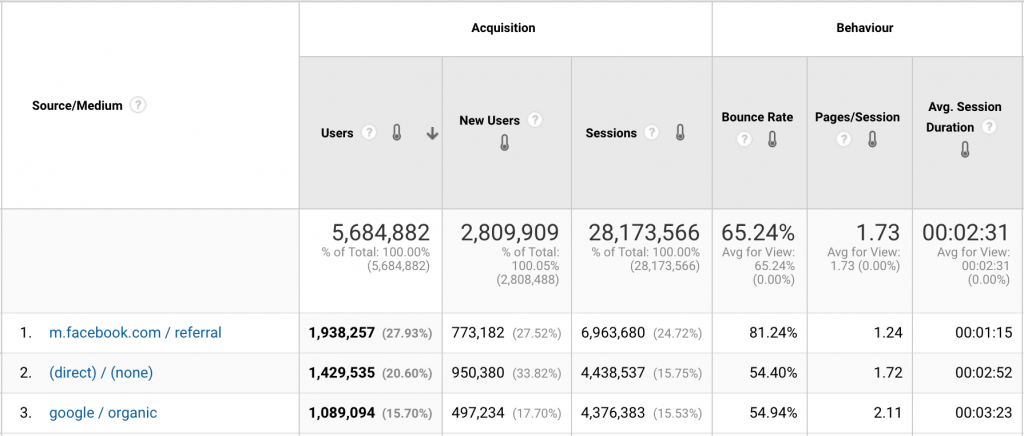
In this example, you can see that direct and organic traffic has far better bounce rates than Facebook referral traffic.
#3 Campaigns
The UTM parameters I mentioned above is one of the most important and most underrated features of Analytics. Without a smart and professional structure of these, you lose the point.
Google Ads is the one and only traffic source which can be connected to GA and this connection provides an automated tagging system.
Every other source, like your newsletters, Facebook Ads, affiliate cooperations or a banner that you bought on a blog: need to be tagged manually with UTM parameters.
This example above shows a conference’s – the Digital Cube Conf’s – different traffic sources and their results in a Campaigns report. As you can see, our tagging structure covers every source differently. The conference has a Facebook Page and of course a Facebook Event. When we shared the final agenda we used unique parameters for these. We followed the same process on our personal social media profiles, too.
#4 Events
After we have validated our basic tracking through real-time reports, checked our sources and created a structure for UTM parameters: we should focus on what our visitors are doing onsite. The best way to track user interactions – like clicking the subscribe button, filling a form, downloading a PDF or starting a video/podcast on the website – is events.
With a few short javascript snippets (or by using Google Tag Manager) you can track almost everything.
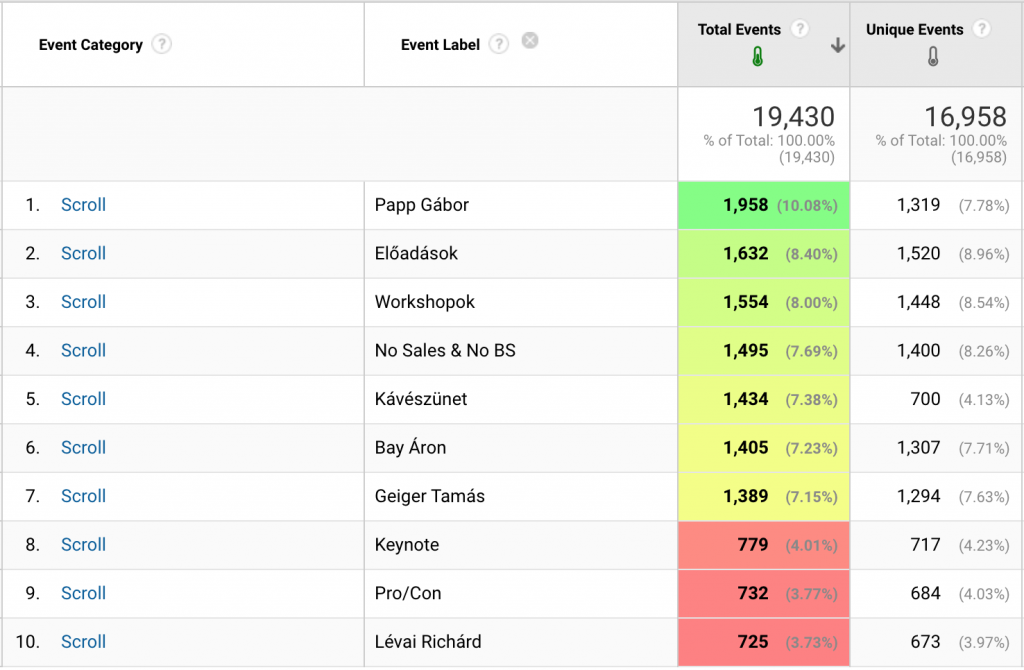
The event on this example above tracks main blocks on our conference website. The event category is scrolling and the labels are the blocks.
Note: And if you want this fancy heatmap inside the GA, you should try Da Vinci tools. It’s free and has a lot of exciting features: https://www.davinci.tools/
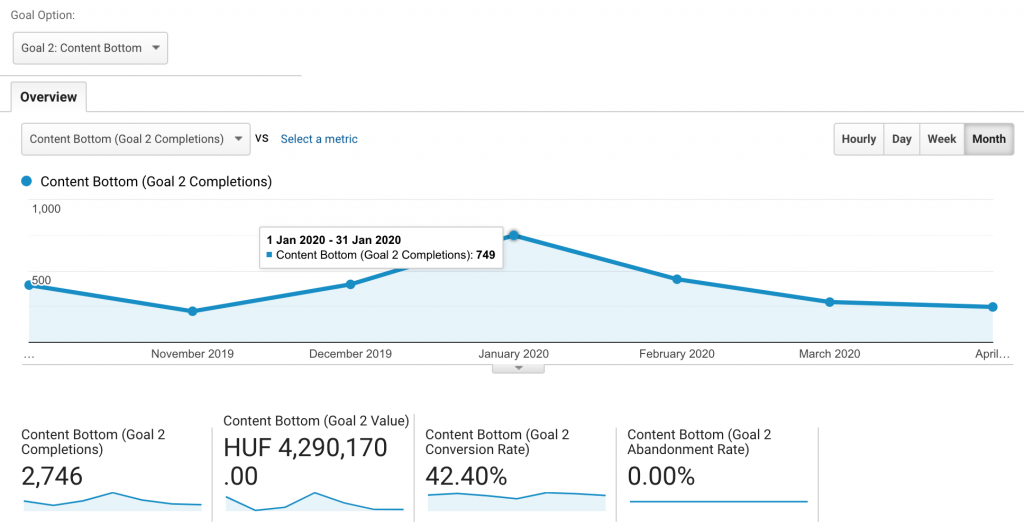
#5 Goals
Each website should have key-metrics. In Google Analytics, we call them goals. Goals can be based on Destination (the user visited a specific URL on our website), Duration (eg. user spent 3 minutes on-site), Pages/Screens per session (eg. user visited 3 pages) or Event (like scrolling or clicking a button).
On our blog, PPC Pro, we are using a goal to see how many people scrolled down to the bottom of an article. But it is just the simplest example. You can use goals to track the number of your workshop purchases or registrations, see how many users placed a product in the basket at your webshop or monitor how many articles are read by the visitors.
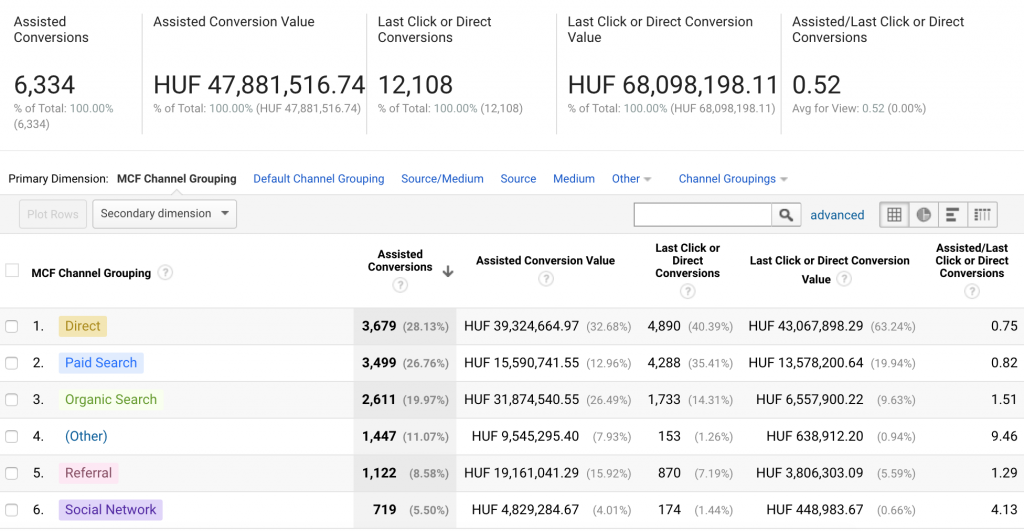
#6 Multi-Channel Funnels (MFC)
In Analytics, the conversions and the E-commerce transactions are allocated to the last organic search, referrer website, campaign or ad. This is the Last Interaction attribution model which attributes 100% of the conversion value to the last channel. But most often this is not showing us the whole picture.
Imagine a situation where you want to purchase something (eg. an online course). You go to Google and search for a keyword. Then you click on an ad and go to the website. On the site you will check the landing page, maybe read an article and subscribe to a free course. You will get the emails and after you finish the course, the website will start a remarketing campaign on Facebook to show you other courses or discounts. At last, you search again for a long tail keyword like “advanced fishing course with Jim”, clicking on an organic result and buying it. With Multi Channel Funnels report you can give real credit for every other source, not just the last organic one.
If you have set up Goals or E-commerce tracking and want to evaluate the direct and assisted conversions for different channels then the Multi-Channel Funnels reports will be your best friend. When you are not sure that some traffic or campaign generates any useful results, you can analyze these numbers.
Besides the basic metrics — which are easily understandable — Assisted/Last Click or Direct Conversions can be the main indicator for business decisions.
About the Assisted/Last Click or Direct Conversions metric from Google Analytics interface: A value close to 0 indicates that this channel functioned primarily as the final conversion interaction. A value close to 1 indicates that this channel functioned equally in an assist role and as the final conversion interaction. The more this value exceeds 1, the more this channel functioned in an assist role.
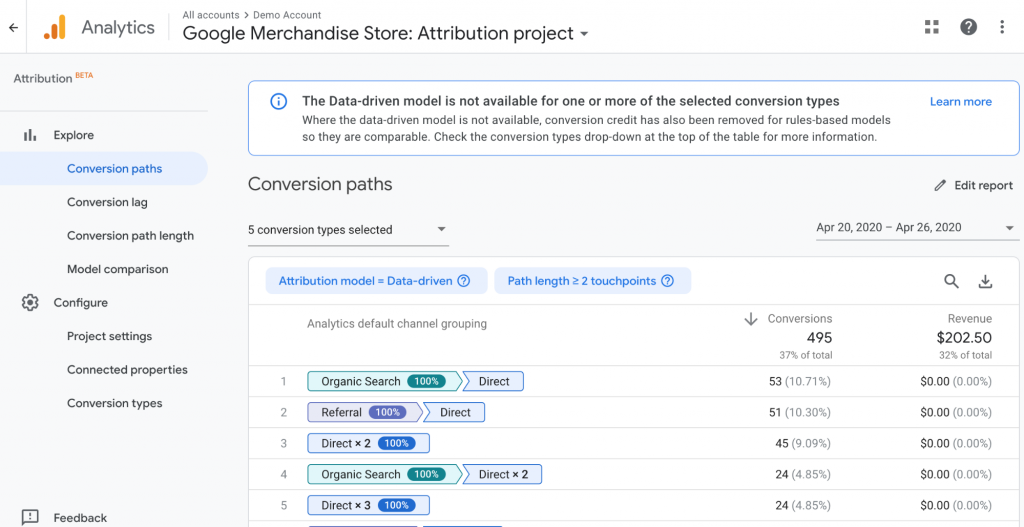
#7 Attribution
If you have an almost perfect Analytics setup with a working UTM logic, Goals and/or Ecommerce tracking and event tracking, then attribution modelling is a real option for you.
In the multi-channel function reports section I’ve already mentioned attribution. An attribution model helps you to analyze your data from different points of view. You can read more in Analytics Help about the classic models like
- Last Interaction,
- Last Non-Direct Click,
- First Interaction,
- Linear,
- Time Decay or
- Position Based.
Google recently made this Attribution beta feature publicly available. In this tool you can create attribution projects for an account with a definitive goal. But keep in mind that it’s still in beta. (The most exciting part is the Data-driven model.)
Anyway: if you have enough data, create a project and check these reports, too!
+1 Analytics Intelligence
This function is based on machine learning and helps you to better understand your data.
It has 3 main functions:
- You can ask questions: ask Analytics Intelligence about your data in plain English, and get answers. You can ask basic questions like “How many new users did we get last week on mobile?”, why questions like “Why is my bounce rate increasing?” or anomaly questions like “Is there a problem with my ads?” And of course, you can check performance, trends or compare data sets.
- Get insights: Intelligence analyzes your data and generates insights about website performance automatically (example below).
- User and conversion modelling: Intelligence powers Smart Lists, Smart Goals, Conversion Probability and Session Quality, which you can use to create audiences.
From this short video, you can get more information about this feature:
Conclusion
I hope this shortlist of top Google Analytics reports was useful for you. In the next article, I will show you the process of creating a complex Analytics account audit. Until then, happy analyzing!
Cheers,
Aron Bay
Thanks to Aron for the great Article — it’s Tomi again. And I’m here to add a few more thoughts quickly — as usual:
- If you want to learn more about how to become a data scientist, take my 50-minute video course: How to Become a Data Scientist. (It’s free!)
- If you want to learn everything that you have to know about A/B testing (business elements, science elements, best practices, common mistakes, etc.) and become a real pro in building winning experiments, take my new online A/B testing course called A/B test like a Data Scientist!
Resources:
- https://analytics.google.com/
- https://brianclifton.com/blog/2015/11/10/google-analytics-is-10-what-has-changed/
- https://w3techs.com/technologies/details/ta-googleanalytics
- https://www.blog.google/products/marketingplatform/analytics/new-way-unify-app-and-website-measurement-google-analytics/
- https://support.google.com/analytics/answer/7411707?hl=en&ref_topic=7346206